All scans · Long
Quiet Buying
Open live →ZenBot is a free real-time scanner that surfaces the stocks in play — heavy volume, leading their sector, moving before the crowd. This is one of its built-in scans.
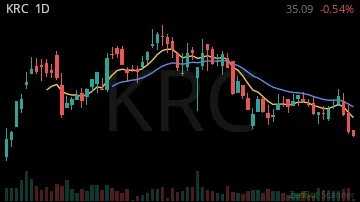
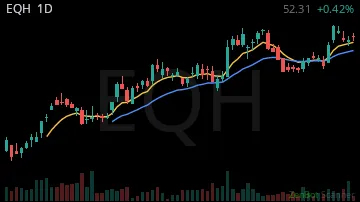
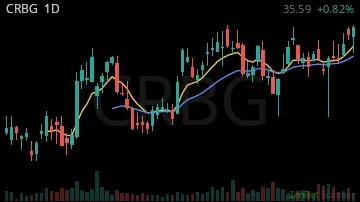

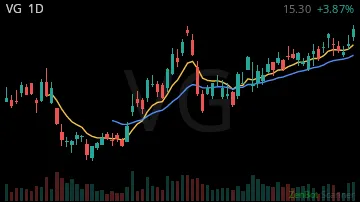
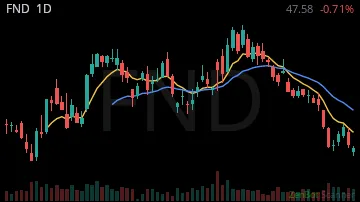
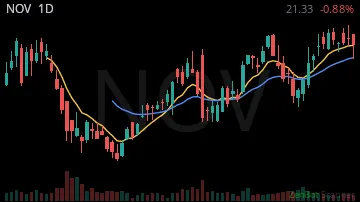
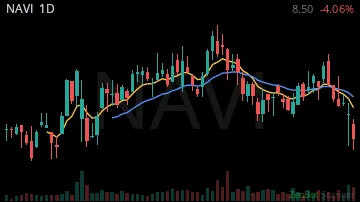
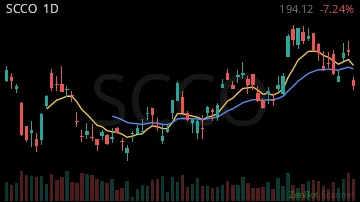
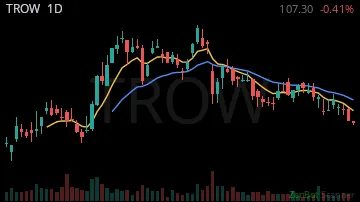
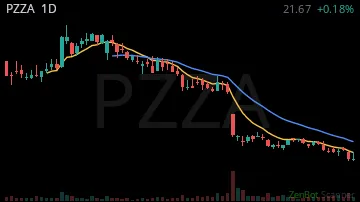
| Symbol | Chart | Sector | Last | Chg % | Chg $ | RS 1H | RS 2W | RVOL | Vol |
|---|---|---|---|---|---|---|---|---|---|
| KRC |  | Real Estate | 37.26 | +0.04% | +1.30 | 0.00 | 4.00 | 219% | 3.1M |
| EQH |  | Finance | 52.76 | -0.04% | -2.28 | 0.00 | 2.52 | 197% | 5.4M |
| CRBG | 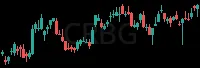 | Finance | 34.14 | -0.04% | -1.46 | 0.00 | 2.61 | 194% | 8.5M |
| DRVN |  | Consumer Dis | 11.74 | -0.01% | -0.08 | 0.00 | 2.29 | 164% | 1.8M |
| VG | 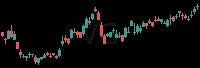 | Utilities | 14.01 | +0.09% | +1.20 | 0.00 | 1.13 | 160% | 22.6M |
| FND | 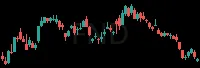 | Consumer Dis | 47.82 | -0.01% | -0.35 | 0.00 | 2.77 | 145% | 3.7M |
| NOV |  | Consumer Dis | 19.76 | +0.05% | +1.00 | 0.00 | 1.66 | 142% | 4.6M |
| NAVI | 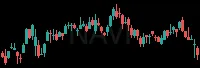 | Finance | 8.49 | -0.04% | -0.37 | 0.00 | 1.93 | 137% | 1.8M |
| SCCO | 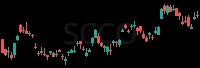 | Basic Materi | 184.96 | +0.01% | +1.37 | 0.00 | -0.31 | 135% | 1.5M |
| TROW |  | Finance | 104.20 | +0.01% | +0.75 | 0.00 | 2.07 | 128% | 2.1M |
| PZZA |  | Consumer Dis | 18.10 | -0.03% | -0.56 | 0.00 | 0.63 | 127% | 1.8M |
RS = relative strength vs SPY, in ATRs (1 hour / 2 weeks); green leads the market, red lags. RVOL = today's volume vs average. Prices are 15-minute delayed.
New here? How to trade these scans · More Trend scans: Strong Daily · Daily Trade Signal · Sector Leaders · All Clear · Coiled Spring · Turning Up · Breakout Day · Range Break - Long · Major MA Break - Long · New Highs · 90-Day Leaders