All scans · Long
Range Break - Long
Open live →ZenBot is a free real-time scanner that surfaces the stocks in play — heavy volume, leading their sector, moving before the crowd. This is one of its built-in scans.
WBD30.98 0.00%

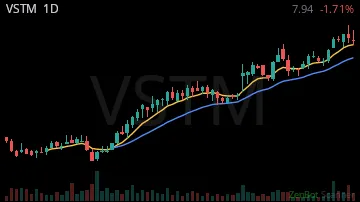
VSTM9.25 +0.20%
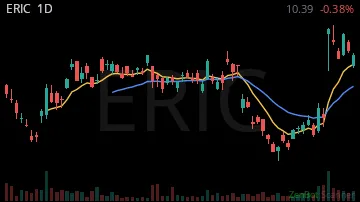
ERIC10.70 +0.12%
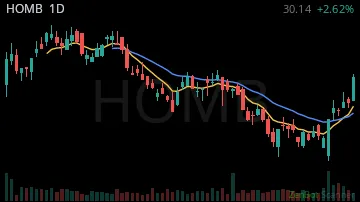
HOMB28.80 +0.02%
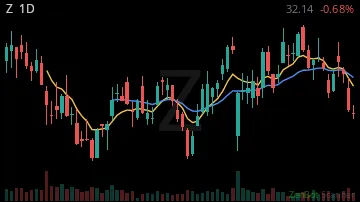
Z31.17 +0.10%
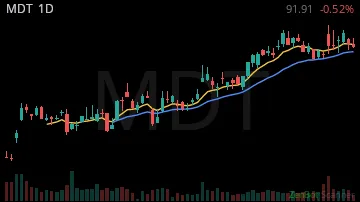
MDT95.45 +0.03%
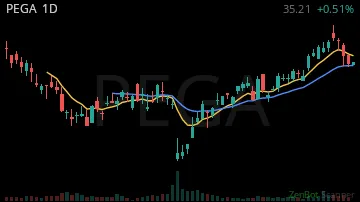
PEGA35.95 +0.05%
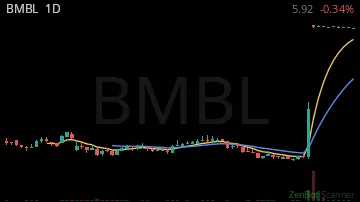
BMBL5.93 -0.01%
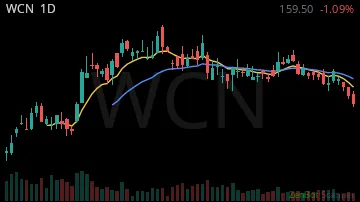
WCN165.51 +0.06%
WM220.00 +0.02%
UL64.65 +0.01%
WMG30.69 +0.06%
WSE12.21 +0.02%
NRIX25.06 +0.13%
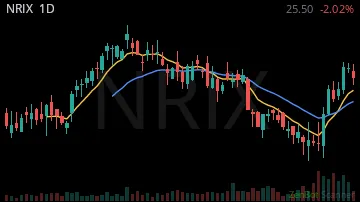
LQDA34.73 +0.30%
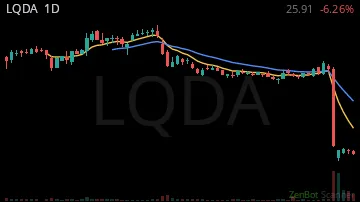
SBUX96.76 +0.05%
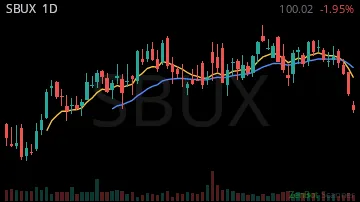
TTE89.63 0.00%
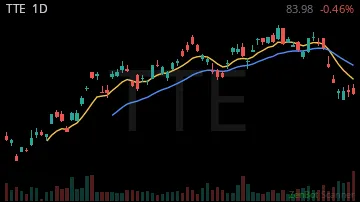
UNH407.25 +0.03%

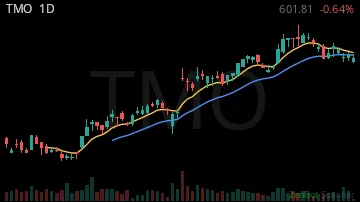
TMO700.00 +0.04%
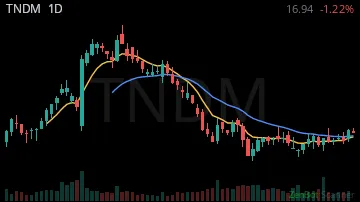
TNDM16.52 +0.03%
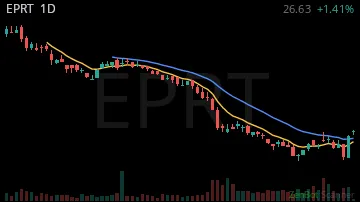
EPRT25.96 +0.01%
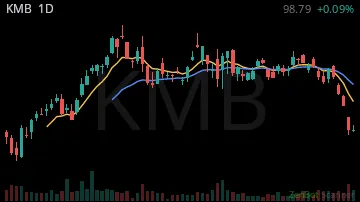
KMB104.07 +0.06%
REAL10.54 +0.07%
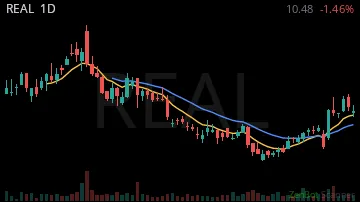
VFC17.08 +0.04%
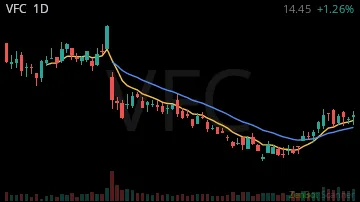
TXRH170.97 +0.03%

LHX241.94 +0.03%
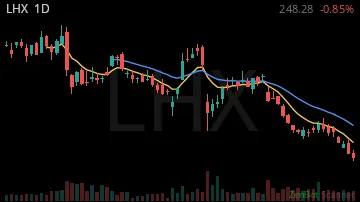
IP34.08 +0.07%
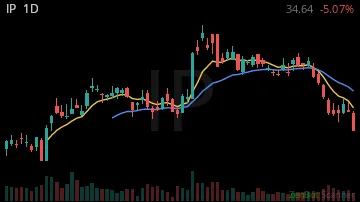
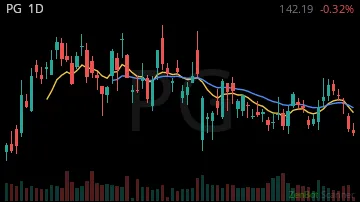
PG157.00 +0.03%
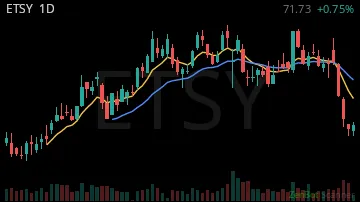
ETSY88.80 +0.12%
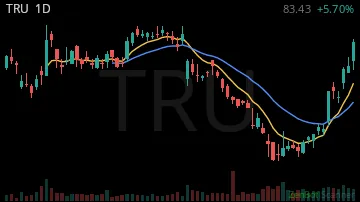
TRU74.50 +0.11%
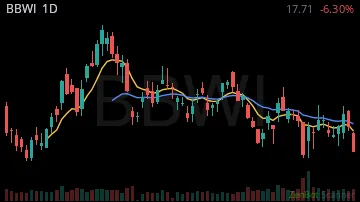
BBWI20.44 +0.08%
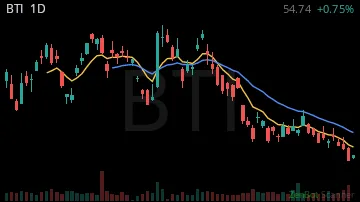
BTI58.00 +0.02%
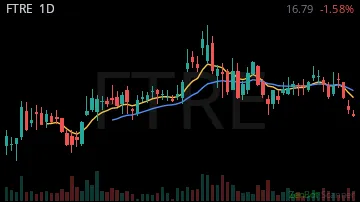
FTRE22.74 +0.09%
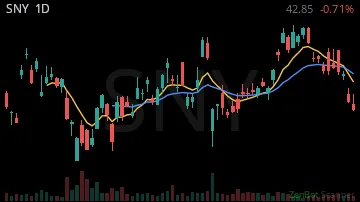
SNY40.30 +0.03%
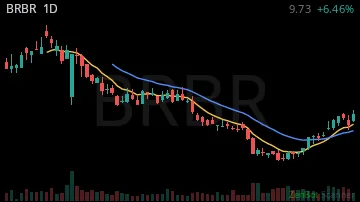
BRBR9.00 +0.04%
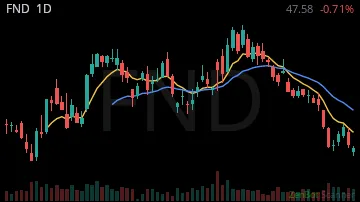
FND46.86 +0.05%
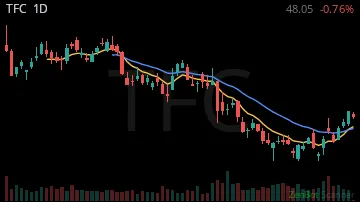
TFC46.57 +0.02%
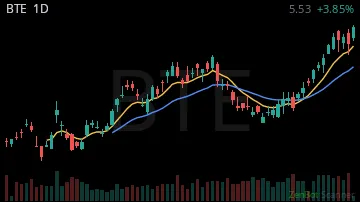
BTE5.20 +0.02%
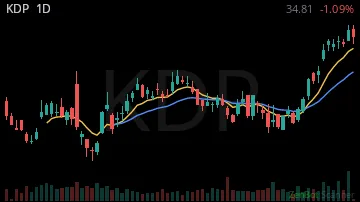
KDP34.00 +0.04%
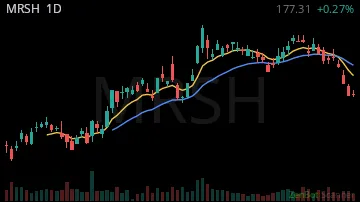
MRSH186.54 +0.05%
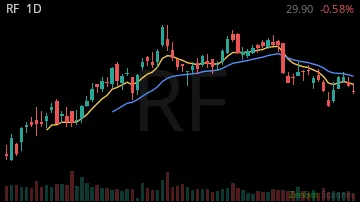
RF27.35 +0.01%
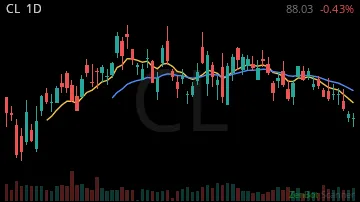
CL92.67 0.00%
ESTC97.31 +0.03%

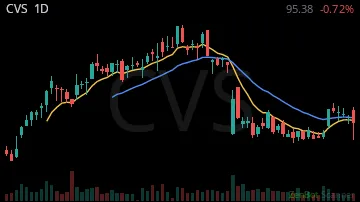
CVS92.30 +0.02%
INFY12.24 +0.07%

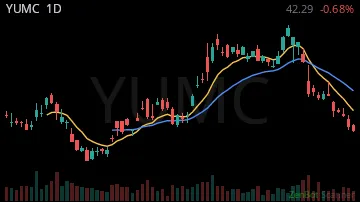
YUMC44.67 +0.03%
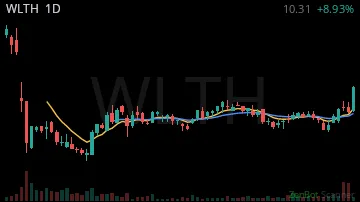
WLTH11.26 +0.08%
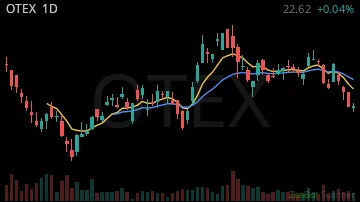
OTEX26.00 +0.04%
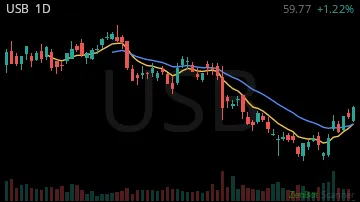
USB57.57 +0.02%
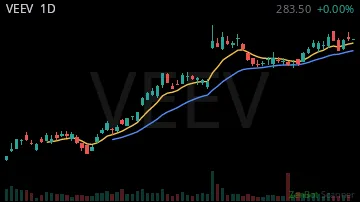
VEEV313.05 +0.05%
ABBV283.70 0.00%

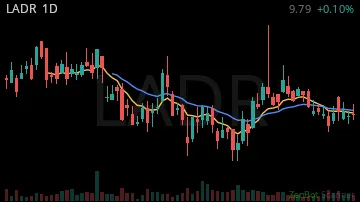
LADR8.82 +0.01%
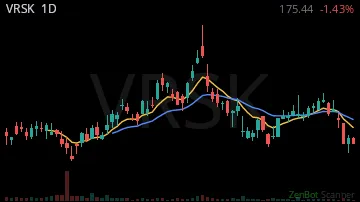
VRSK187.56 +0.04%
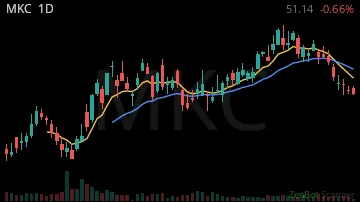
MKC45.99 +0.03%
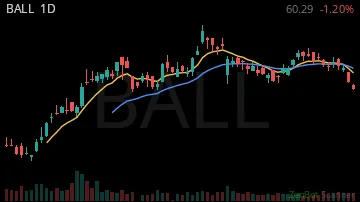
BALL62.80 +0.04%
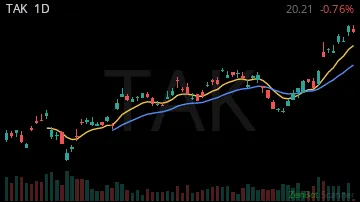
TAK19.47 +0.02%
SYF74.04 +0.03%

LEVI20.51 +0.05%

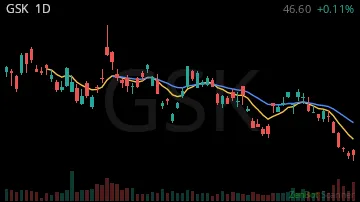
GSK49.02 +0.06%
ARLO12.50 +0.06%

AMX22.43 +0.03%

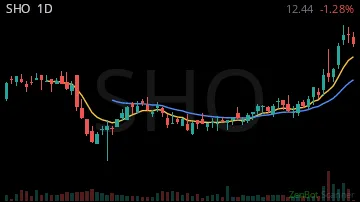
SHO11.87 +0.02%
HBAN15.40 +0.01%

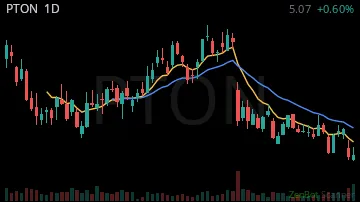
PTON5.32 +0.02%
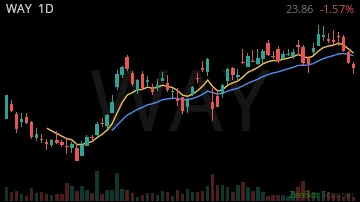
WAY28.35 +0.06%
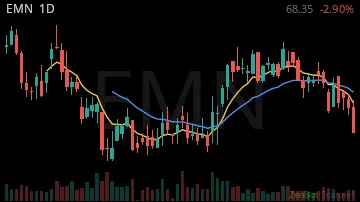
EMN63.87 +0.02%
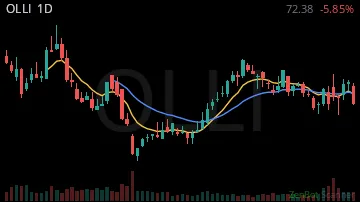
OLLI95.56 +0.08%
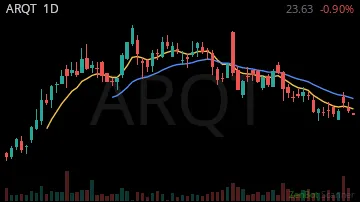
ARQT29.06 +0.10%
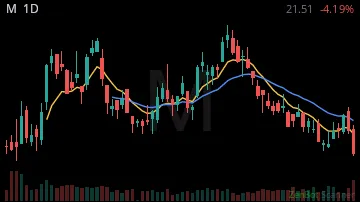
M24.13 +0.06%
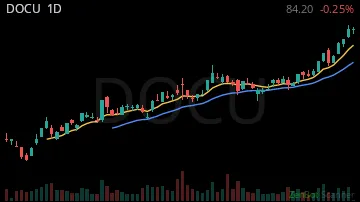
DOCU77.32 +0.03%
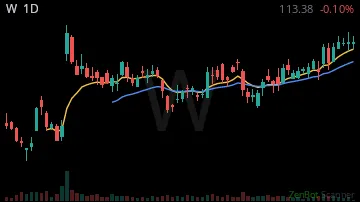
W111.93 +0.07%
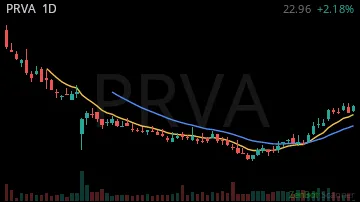
PRVA22.50 +0.04%
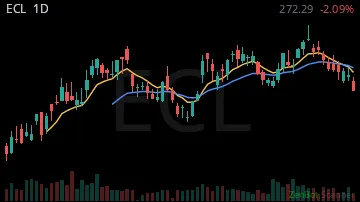
ECL290.76 +0.01%
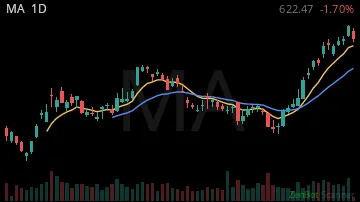
MA616.00 +0.02%
BLMN9.94 +0.06%

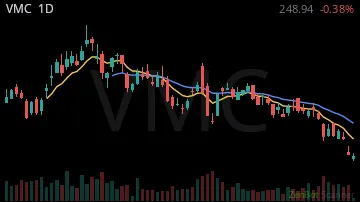
VMC252.40 +0.04%
LLY1252.10 +0.07%

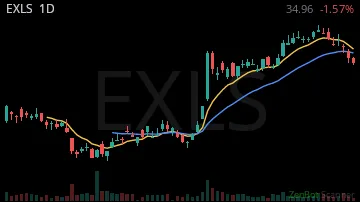
EXLS39.10 +0.05%
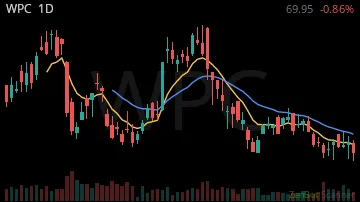
WPC64.45 +0.01%
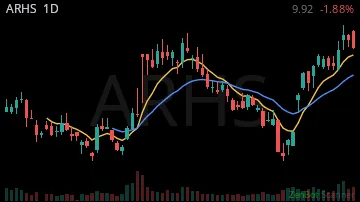
ARHS10.18 +0.09%
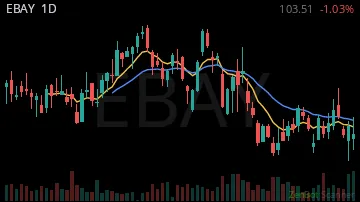
EBAY123.60 +0.06%
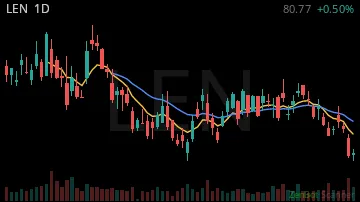
LEN77.78 +0.04%
BJ103.27 0.00%

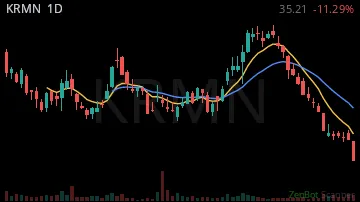
KRMN33.72 +0.12%
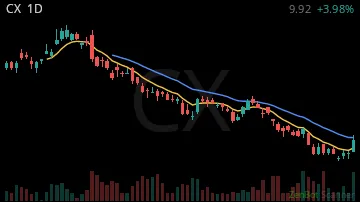
CX10.05 +0.06%
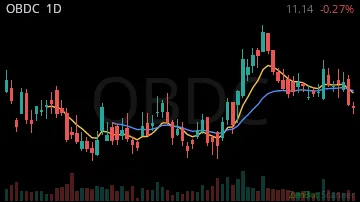
OBDC10.36 +0.03%
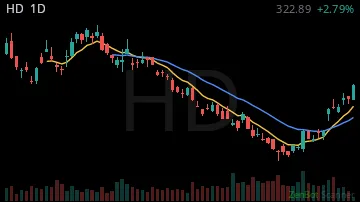
HD308.00 +0.05%
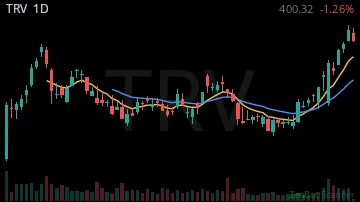
TRV384.10 +0.02%
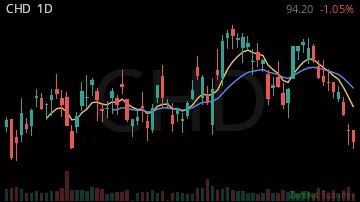
CHD103.08 0.00%
COST977.12 0.00%

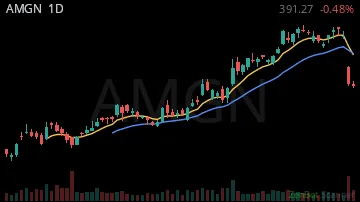
AMGN434.90 +0.02%
RXO29.06 +0.02%

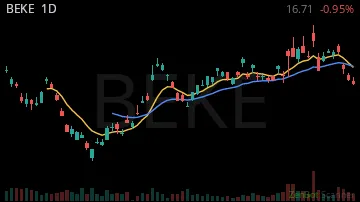
BEKE17.83 +0.02%
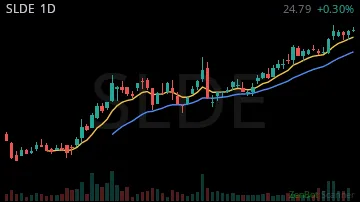
SLDE26.53 +0.04%
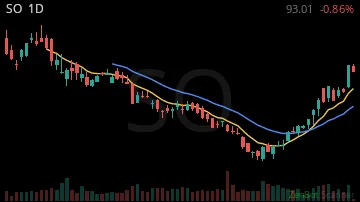
SO89.18 +0.01%
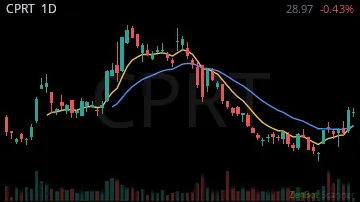
CPRT27.59 +0.05%
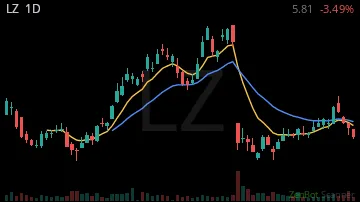
LZ6.20 +0.02%
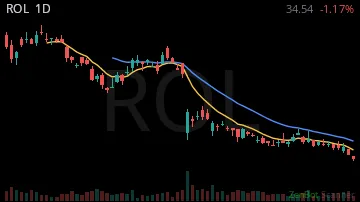
ROL33.89 +0.05%
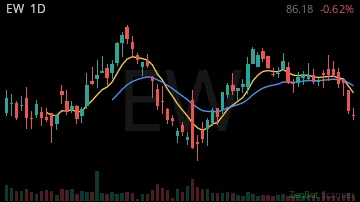
EW88.25 +0.03%
ORI38.67 +0.01%

| Symbol | Chart | Sector | Last | Chg % | Chg $ | RS 1H | RS 2W | RVOL | Vol |
|---|---|---|---|---|---|---|---|---|---|
| WBD |  | Telecommunic | 30.98 | 0.00% | +0.03 | 0.44 | 5.39 | 1,037% | 0 |
| VSTM |  | Health Care | 9.25 | +0.20% | +1.54 | -1.72 | -0.73 | 570% | 16.9M |
| ERIC | 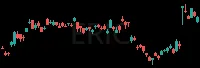 | Technology | 10.70 | +0.12% | +1.12 | -2.27 | 0.19 | 480% | 41.0M |
| HOMB | 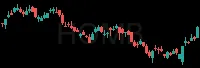 | Finance | 28.80 | +0.02% | +0.44 | 3.73 | -2.80 | 324% | 4.8M |
| Z | 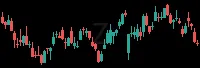 | Consumer Dis | 31.17 | +0.10% | +2.84 | -2.81 | 0.21 | 323% | 13.2M |
| MDT | 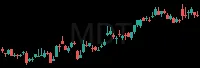 | Health Care | 95.45 | +0.03% | +2.44 | 9.19 | 0.65 | 293% | 50.2M |
| PEGA |  | Technology | 35.95 | +0.05% | +1.57 | -5.56 | -0.61 | 259% | 5.1M |
| BMBL | 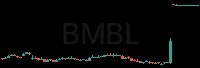 | Technology | 5.93 | -0.01% | -0.04 | 0.57 | 8.95 | 253% | 16.0M |
| WCN | 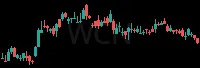 | Utilities | 165.51 | +0.06% | +8.69 | 1.54 | -0.43 | 252% | 4.4M |
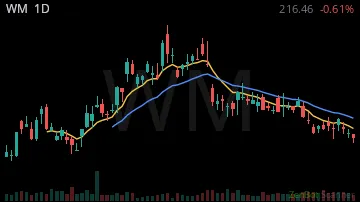
| WM |  | Utilities | 220.00 | +0.02% | +4.25 | -5.13 | 2.10 | 248% | 5.2M |
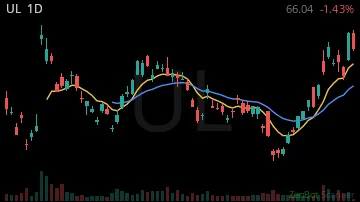
| UL |  | Consumer Dis | 64.65 | +0.01% | +0.79 | 3.63 | 0.70 | 244% | 7.8M |
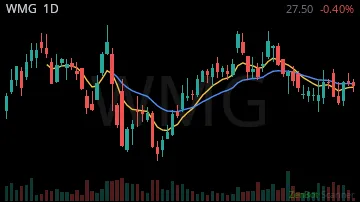
| WMG | 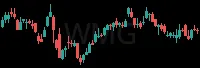 | Consumer Dis | 30.69 | +0.06% | +1.78 | -3.70 | 1.36 | 234% | 5.0M |
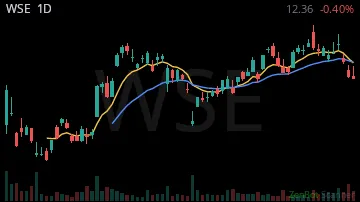
| WSE | 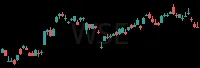 | Industrials | 12.21 | +0.02% | +0.20 | 1.40 | 1.01 | 233% | 3.6M |
| NRIX | 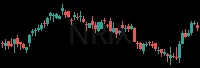 | Health Care | 25.06 | +0.13% | +2.93 | 3.43 | -1.99 | 225% | 3.8M |
| LQDA | 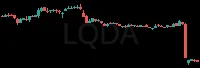 | Health Care | 34.73 | +0.30% | +7.92 | -7.24 | -7.32 | 214% | 7.2M |
| SBUX | 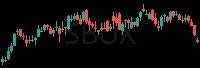 | Consumer Dis | 96.76 | +0.05% | +4.76 | -9.01 | -2.33 | 212% | 15.4M |
| TTE | 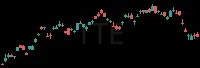 | Energy | 89.63 | 0.00% | -0.01 | 13.30 | -1.00 | 207% | 3.7M |
| UNH |  | Health Care | 407.25 | +0.03% | +11.63 | -5.58 | 0.92 | 203% | 10.2M |
| TMO |  | Industrials | 700.00 | +0.04% | +26.80 | 13.57 | -0.92 | 199% | 4.0M |
| TNDM | 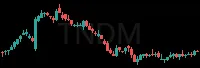 | Health Care | 16.52 | +0.03% | +0.51 | 1.53 | -1.11 | 199% | 4.6M |
| EPRT | 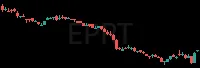 | Real Estate | 25.96 | +0.01% | +0.31 | -2.93 | -2.32 | 198% | 6.0M |
| KMB | 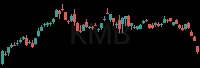 | Consumer Dis | 104.07 | +0.06% | +5.78 | -5.00 | -1.19 | 197% | 7.9M |
| REAL | 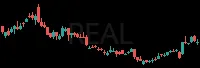 | Consumer Dis | 10.54 | +0.07% | +0.73 | 0.00 | 1.66 | 197% | 5.9M |
| VFC | 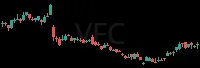 | Industrials | 17.08 | +0.04% | +0.60 | 2.15 | 2.64 | 196% | 15.4M |
| TXRH |  | Consumer Dis | 170.97 | +0.03% | +4.33 | 2.29 | 1.36 | 195% | 2.1M |
| LHX | 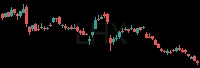 | Industrials | 241.94 | +0.03% | +7.22 | 9.81 | -1.82 | 193% | 3.0M |
| IP | 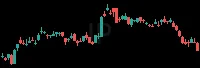 | Basic Materi | 34.08 | +0.07% | +2.27 | 3.56 | -4.68 | 192% | 9.0M |
| PG |  | Consumer Dis | 157.00 | +0.03% | +3.96 | -18.21 | 1.61 | 191% | 16.4M |
| ETSY | 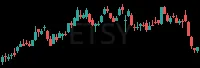 | Consumer Dis | 88.80 | +0.12% | +9.52 | 2.16 | 3.02 | 189% | 6.1M |
| TRU | 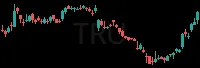 | Finance | 74.50 | +0.11% | +7.56 | 5.37 | -0.36 | 189% | 4.5M |
| BBWI | 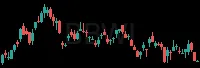 | Consumer Dis | 20.44 | +0.08% | +1.49 | -0.24 | 3.31 | 186% | 12.6M |
| BTI |  | Consumer Sta | 58.00 | +0.02% | +1.34 | 2.63 | 0.01 | 186% | 8.6M |
| FTRE |  | Health Care | 22.74 | +0.09% | +1.82 | -2.06 | -0.15 | 185% | 2.9M |
| SNY | 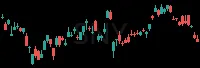 | Health Care | 40.30 | +0.03% | +1.18 | 15.63 | -3.77 | 184% | 5.1M |
| BRBR | 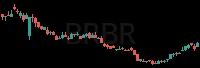 | Consumer Sta | 9.00 | +0.04% | +0.34 | 5.76 | 1.70 | 183% | 6.6M |
| FND | 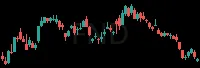 | Consumer Dis | 46.86 | +0.05% | +2.14 | 13.35 | -2.43 | 181% | 4.3M |
| TFC | 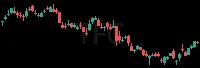 | Finance | 46.57 | +0.02% | +1.00 | 3.91 | -2.41 | 178% | 12.6M |
| BTE |  | Energy | 5.20 | +0.02% | +0.12 | -0.52 | 2.75 | 177% | 28.9M |
| KDP | 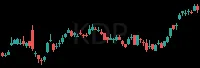 | Consumer Sta | 34.00 | +0.04% | +1.34 | -13.83 | -0.31 | 176% | 19.0M |
| MRSH | 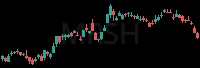 | Finance | 186.54 | +0.05% | +9.53 | 2.59 | 0.69 | 175% | 4.2M |
| RF |  | Finance | 27.35 | +0.01% | +0.34 | 3.83 | -2.29 | 174% | 15.1M |
| CL |  | Consumer Dis | 92.67 | 0.00% | -0.11 | 2.63 | 3.55 | 174% | 8.2M |
| ESTC | 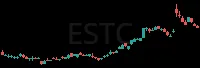 | Technology | 97.31 | +0.03% | +2.99 | 13.22 | 0.62 | 173% | 4.2M |
| CVS |  | Consumer Sta | 92.30 | +0.02% | +1.91 | -1.60 | 0.48 | 173% | 14.3M |
| INFY |  | Technology | 12.24 | +0.07% | +0.84 | 5.89 | 1.20 | 173% | 29.6M |
| YUMC | 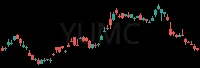 | Consumer Dis | 44.67 | +0.03% | +1.47 | 0.00 | 1.95 | 172% | 2.5M |
| WLTH | 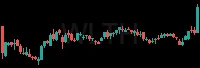 | Finance | 11.26 | +0.08% | +0.81 | 9.92 | 0.25 | 171% | 4.3M |
| OTEX |  | Technology | 26.00 | +0.04% | +1.05 | 7.92 | 2.34 | 170% | 2.5M |
| USB | 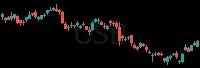 | Finance | 57.57 | +0.02% | +1.31 | 10.22 | -3.14 | 170% | 12.1M |
| VEEV | 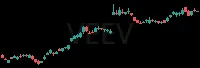 | Technology | 313.05 | +0.05% | +15.70 | -2.91 | 1.17 | 168% | 2.9M |
| ABBV |  | Health Care | 283.70 | 0.00% | +0.22 | 8.58 | 1.88 | 168% | 7.6M |
| LADR | 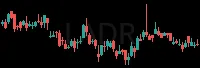 | Real Estate | 8.82 | +0.01% | +0.08 | -5.28 | -2.82 | 167% | 3.0M |
| VRSK | 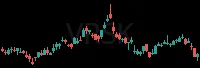 | Technology | 187.56 | +0.04% | +6.98 | 1.39 | 2.26 | 166% | 2.0M |
| MKC |  | Consumer Sta | 45.99 | +0.03% | +1.35 | 13.57 | -3.39 | 164% | 5.3M |
| BALL |  | Industrials | 62.80 | +0.04% | +2.37 | 2.35 | 2.14 | 163% | 3.2M |
| TAK | 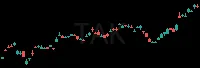 | Health Care | 19.47 | +0.02% | +0.46 | 0.34 | -0.30 | 163% | 4.4M |
| SYF |  | Finance | 74.04 | +0.03% | +2.32 | 0.78 | -0.51 | 163% | 4.9M |
| LEVI |  | Consumer Dis | 20.51 | +0.05% | +1.03 | -17.42 | -1.53 | 162% | 5.4M |
| GSK | 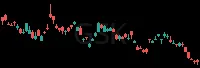 | Health Care | 49.02 | +0.06% | +2.75 | 0.00 | -4.72 | 162% | 6.1M |
| ARLO |  | Consumer Dis | 12.50 | +0.06% | +0.68 | 7.36 | -2.38 | 160% | 2.6M |
| AMX | 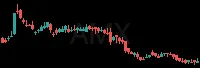 | Telecommunic | 22.43 | +0.03% | +0.59 | 1.20 | -0.33 | 160% | 5.1M |
| SHO | 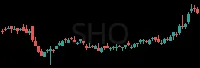 | Consumer Dis | 11.87 | +0.02% | +0.22 | -2.69 | 1.01 | 159% | 5.5M |
| HBAN |  | Finance | 15.40 | +0.01% | +0.16 | 2.97 | -2.46 | 158% | 40.6M |
| PTON | 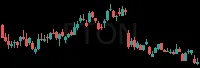 | Consumer Dis | 5.32 | +0.02% | +0.10 | 1.94 | 0.46 | 158% | 14.0M |
| WAY | 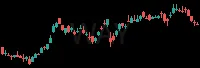 | Technology | 28.35 | +0.06% | +1.48 | 5.62 | 0.36 | 157% | 3.5M |
| EMN | 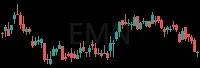 | Industrials | 63.87 | +0.02% | +0.99 | 1.11 | -2.95 | 157% | 2.3M |
| OLLI | 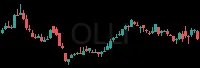 | Consumer Dis | 95.56 | +0.08% | +7.23 | 2.63 | 0.26 | 156% | 2.7M |
| ARQT | 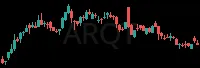 | Health Care | 29.06 | +0.10% | +2.65 | -0.79 | -1.45 | 155% | 4.0M |
| M | 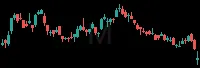 | Consumer Dis | 24.13 | +0.06% | +1.39 | -2.69 | -0.99 | 154% | 9.4M |
| DOCU | 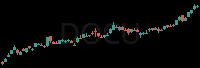 | Technology | 77.32 | +0.03% | +2.09 | 0.15 | 2.74 | 154% | 4.9M |
| W | 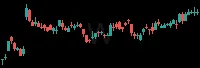 | Consumer Dis | 111.93 | +0.07% | +7.15 | 0.00 | 0.78 | 154% | 3.7M |
| PRVA | 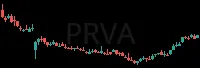 | Health Care | 22.50 | +0.04% | +0.85 | -12.70 | 2.00 | 153% | 2.0M |
| ECL |  | Consumer Dis | 290.76 | +0.01% | +3.05 | -2.27 | 0.85 | 153% | 1.9M |
| MA |  | Finance | 616.00 | +0.02% | +11.20 | 8.70 | 2.56 | 152% | 4.2M |
| BLMN | 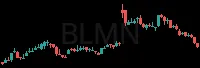 | Consumer Dis | 9.94 | +0.06% | +0.59 | 0.71 | 2.52 | 152% | 3.6M |
| VMC | 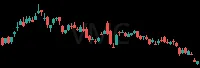 | Industrials | 252.40 | +0.04% | +10.63 | 2.21 | -1.37 | 152% | 1.7M |
| LLY | 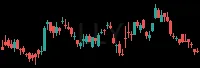 | Health Care | 1252.10 | +0.07% | +85.59 | -1.69 | -1.63 | 151% | 3.8M |
| EXLS | 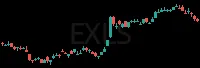 | Consumer Dis | 39.10 | +0.05% | +1.90 | 3.93 | 1.27 | 151% | 3.0M |
| WPC |  | Real Estate | 64.45 | +0.01% | +0.89 | 2.49 | -2.62 | 151% | 2.1M |
| ARHS | 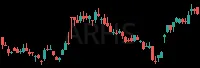 | Consumer Dis | 10.18 | +0.09% | +0.88 | 1.09 | -1.47 | 150% | 2.2M |
| EBAY |  | Consumer Dis | 123.60 | +0.06% | +6.72 | 6.64 | 2.42 | 150% | 7.3M |
| LEN | 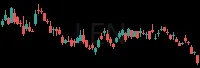 | Consumer Dis | 77.78 | +0.04% | +2.86 | 8.65 | -3.41 | 150% | 6.3M |
| BJ | 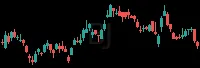 | Consumer Sta | 103.27 | 0.00% | -0.12 | 2.55 | 1.65 | 150% | 2.8M |
| KRMN | 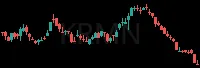 | Industrials | 33.72 | +0.12% | +3.57 | -6.28 | -3.91 | 149% | 4.8M |
| CX | 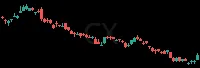 | Industrials | 10.05 | +0.06% | +0.53 | -0.60 | -0.68 | 149% | 12.8M |
| OBDC |  | Finance | 10.36 | +0.03% | +0.29 | 7.02 | -4.57 | 148% | 5.5M |
| HD |  | Consumer Dis | 308.00 | +0.05% | +14.08 | -0.24 | -0.99 | 148% | 6.7M |
| TRV | 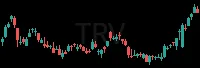 | Finance | 384.10 | +0.02% | +6.28 | 4.77 | 1.77 | 147% | 2.1M |
| CHD |  | Consumer Dis | 103.08 | 0.00% | +0.45 | 2.63 | 3.99 | 147% | 2.6M |
| COST | 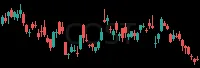 | Consumer Sta | 977.12 | 0.00% | -4.88 | -5.47 | 3.27 | 147% | 3.0M |
| AMGN | 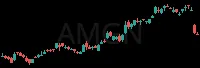 | Health Care | 434.90 | +0.02% | +8.79 | -1.81 | 0.14 | 146% | 4.6M |
| RXO | 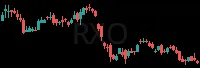 | Consumer Dis | 29.06 | +0.02% | +0.46 | 2.46 | 5.84 | 145% | 5.3M |
| BEKE | 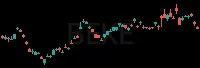 | Finance | 17.83 | +0.02% | +0.31 | 1.15 | 0.86 | 145% | 6.8M |
| SLDE | 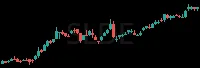 | Finance | 26.53 | +0.04% | +1.03 | 1.59 | 1.97 | 145% | 1.7M |
| SO | 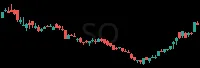 | Utilities | 89.18 | +0.01% | +1.07 | 1.05 | 2.98 | 145% | 8.6M |
| CPRT | 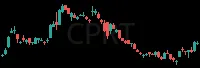 | Consumer Dis | 27.59 | +0.05% | +1.32 | -6.46 | -2.01 | 145% | 14.5M |
| LZ |  | Technology | 6.20 | +0.02% | +0.15 | 4.09 | 1.23 | 144% | 4.3M |
| ROL |  | Consumer Dis | 33.89 | +0.05% | +1.74 | 3.33 | 1.38 | 144% | 9.3M |
| EW | 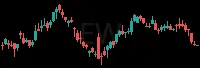 | Health Care | 88.25 | +0.03% | +2.98 | 5.25 | -1.59 | 143% | 4.7M |
| ORI |  | Finance | 38.67 | +0.01% | +0.52 | -1.72 | -0.44 | 143% | 3.0M |
RS = relative strength vs SPY, in ATRs (1 hour / 2 weeks); green leads the market, red lags. RVOL = today's volume vs average. Prices are 15-minute delayed.
New here? How to trade these scans · More Trend scans: Strong Daily · Daily Trade Signal · Sector Leaders · All Clear · Coiled Spring · Quiet Buying · Turning Up · Breakout Day · Major MA Break - Long · New Highs · 90-Day Leaders