All scans · Short
Turning Down
Open live →ZenBot is a free real-time scanner that surfaces the stocks in play — heavy volume, leading their sector, moving before the crowd. This is one of its built-in scans.
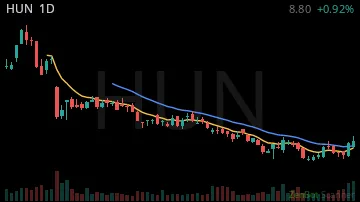
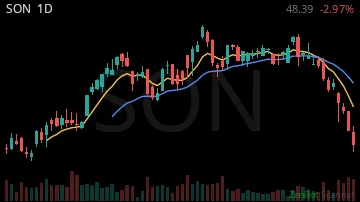
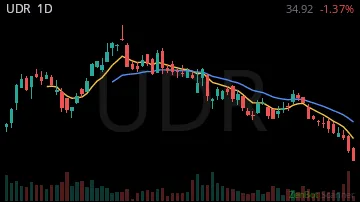
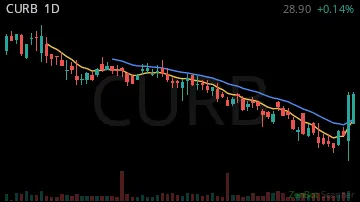
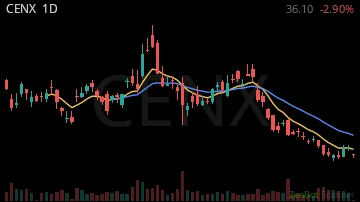
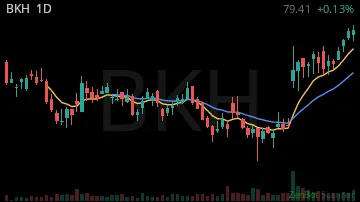

| Symbol | Chart | Sector | Last | Chg % | Chg $ | RS 1H | RS 2W | RVOL | Vol |
|---|---|---|---|---|---|---|---|---|---|
| HUN |  | Industrials | 8.79 | +0.01% | +0.07 | 0.00 | 1.98 | 225% | 5.8M |
| SON |  | Consumer Dis | 50.11 | 0.00% | -0.16 | 0.00 | 3.70 | 208% | 2.4M |
| UDR | 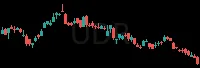 | Real Estate | 35.85 | -0.01% | -0.34 | 0.00 | 5.45 | 174% | 6.6M |
| CURB | 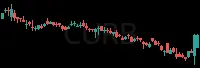 | Finance | 28.86 | 0.00% | 0.00 | 0.00 | 3.23 | 142% | 2.1M |
| CENX | 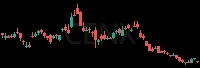 | Industrials | 31.42 | -0.04% | -1.23 | 0.00 | -0.66 | 140% | 2.7M |
| BKH | 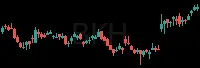 | Utilities | 79.44 | 0.00% | +0.13 | 0.00 | 6.21 | 136% | 1.5M |
| ESI |  | Industrials | 33.21 | 0.00% | +0.10 | 0.00 | -1.02 | 128% | 5.8M |
RS = relative strength vs SPY, in ATRs (1 hour / 2 weeks); green leads the market, red lags. RVOL = today's volume vs average. Prices are 15-minute delayed.
New here? How to trade these scans · More Trend scans: Weak Daily · Sector Laggards · Coiled Spring · Quiet Selling · Breakdown Day · Range Break - Short · Major MA Break - Short · New Lows