All scans · Long
SMA Magnet - Long
Open live →ZenBot is a free real-time scanner that surfaces the stocks in play — heavy volume, leading their sector, moving before the crowd. This is one of its built-in scans.
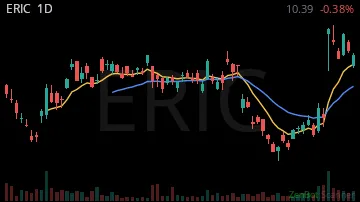
ERIC10.70 +0.12%
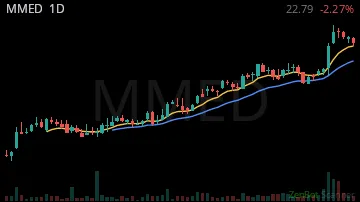
MMED17.82 -0.03%
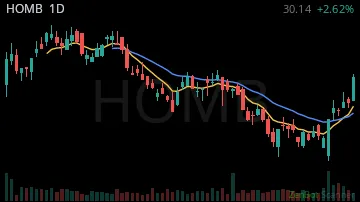
HOMB28.80 +0.02%
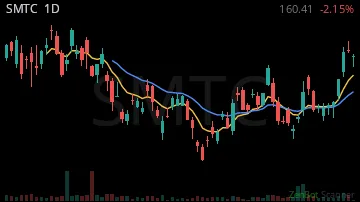
SMTC148.50 -0.14%
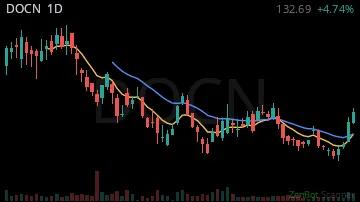
DOCN109.89 +0.01%
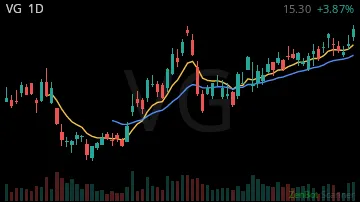
VG12.55 -0.05%
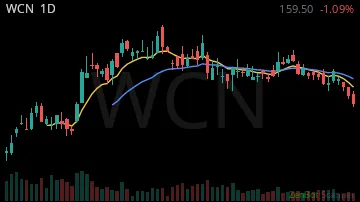
WCN165.51 +0.06%
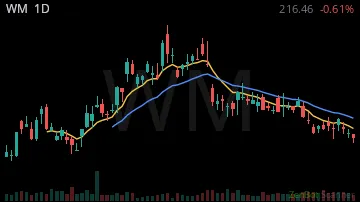
WM220.00 +0.02%
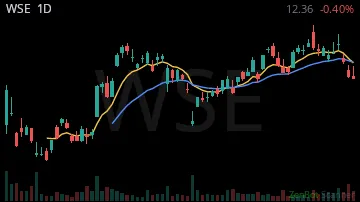
WSE12.21 +0.02%
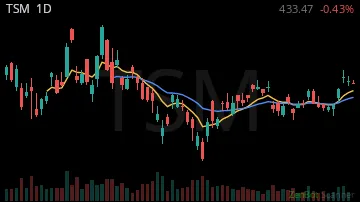
TSM424.50 -0.01%
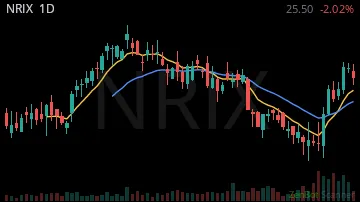
NRIX25.06 +0.13%
JCI147.33 -0.06%

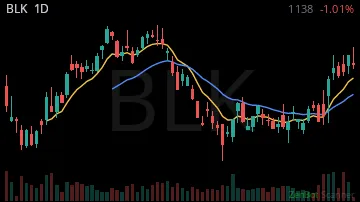
BLK1112.55 +0.04%
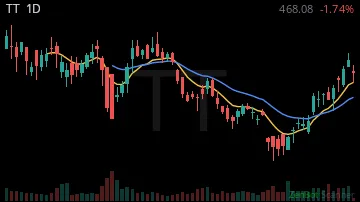
TT447.79 -0.05%
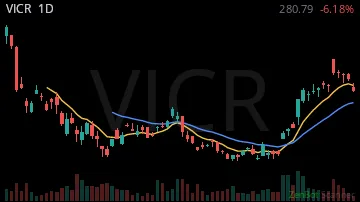
VICR221.00 -0.10%
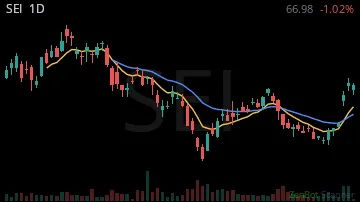
SEI65.99 -0.15%
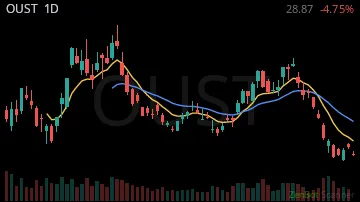
OUST31.54 -0.11%
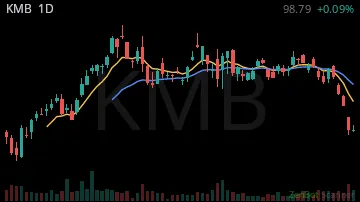
KMB104.40 +0.06%
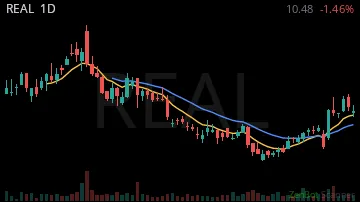
REAL10.54 +0.07%
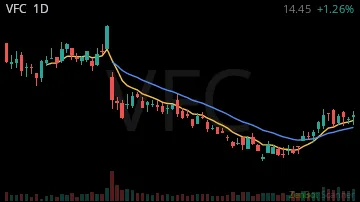
VFC17.25 +0.05%
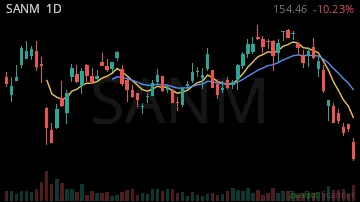
SANM188.04 -0.11%
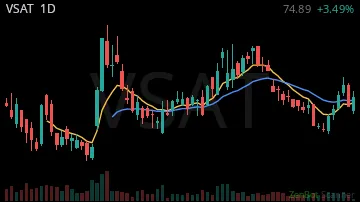
VSAT62.28 +0.01%
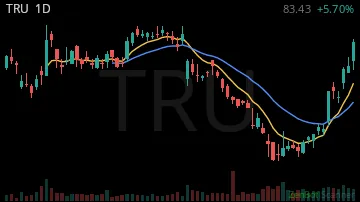
TRU74.50 +0.11%
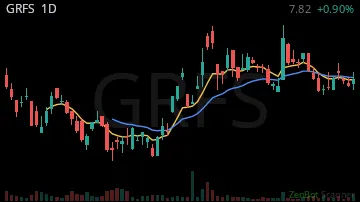
GRFS7.56 +0.05%
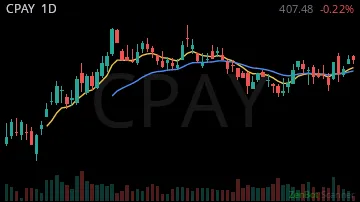
CPAY406.20 +0.03%
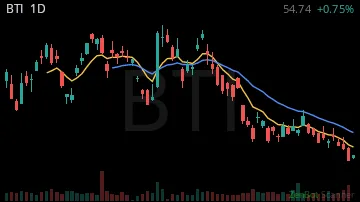
BTI58.00 +0.02%
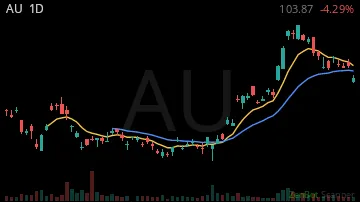
AU91.51 +0.03%
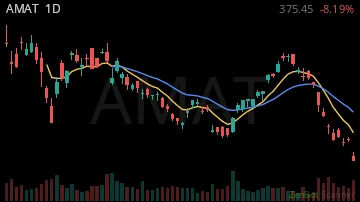
AMAT429.51 -0.04%
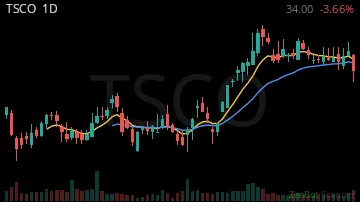
TSCO32.79 0.00%
ANET185.99 -0.05%
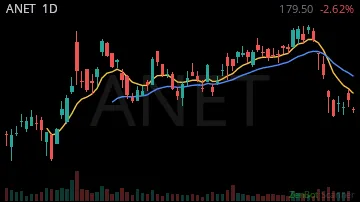
LXU10.99 +0.07%

TER343.99 -0.04%

GEV930.93 -0.07%
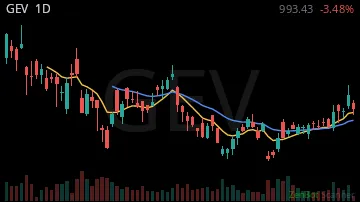
CVS92.38 +0.02%
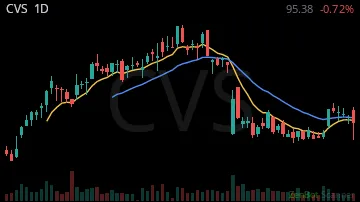
BLCO16.66 +0.04%
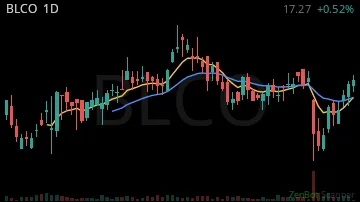
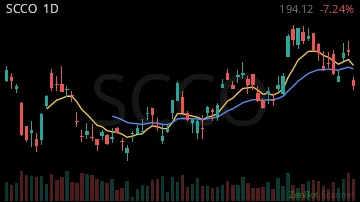
SCCO203.00 -0.02%
VIAV37.14 -0.04%

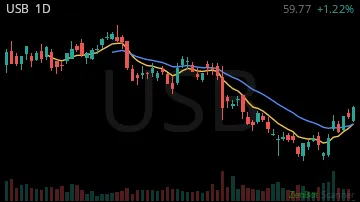
USB57.57 +0.02%
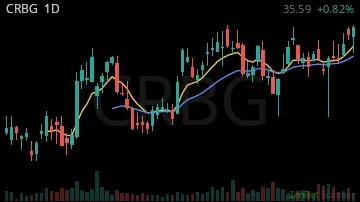
CRBG34.43 +0.01%
SYF74.04 +0.03%

LEVI20.63 +0.06%

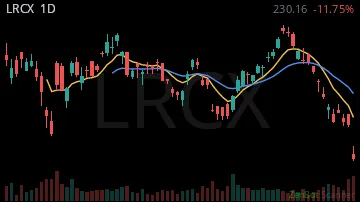
LRCX278.95 -0.07%
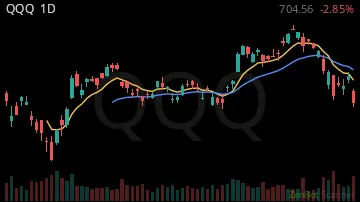
QQQ726.22 0.00%
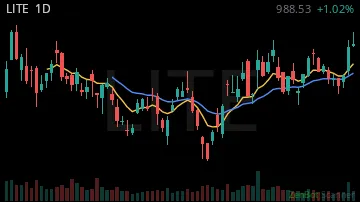
LITE876.92 -0.11%
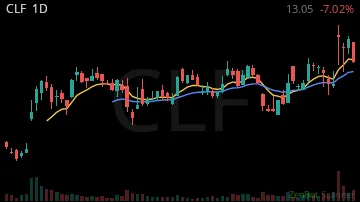
CLF12.16 -0.03%
NXPI229.68 +0.01%

AMX22.43 +0.03%

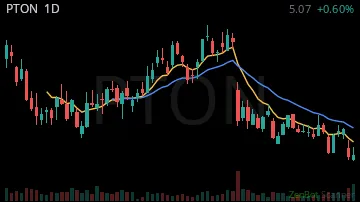
PTON5.26 +0.01%
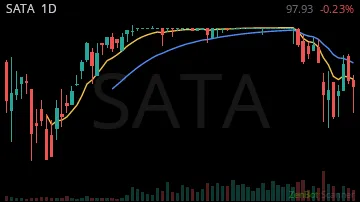
SATA98.60 0.00%
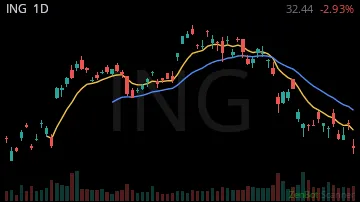
ING33.19 -0.01%
URI1047.00 +0.01%

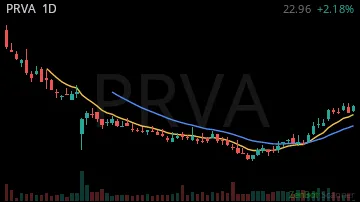
PRVA22.50 +0.04%
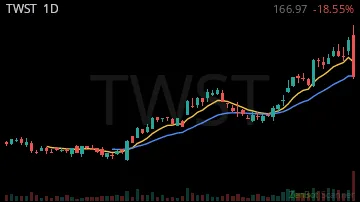
TWST144.50 -0.02%
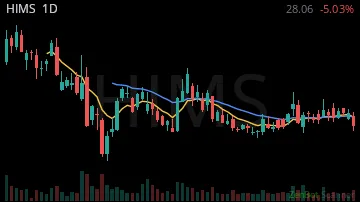
HIMS29.15 -0.02%
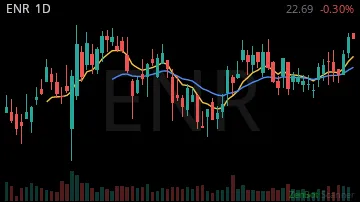
ENR22.00 0.00%
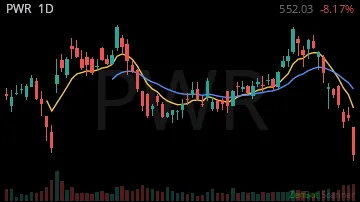
PWR644.21 -0.06%
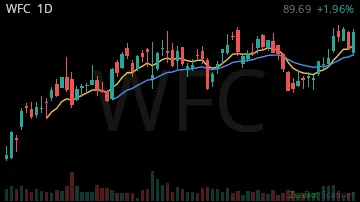
WFC82.85 +0.02%
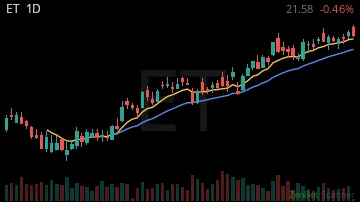
ET20.00 -0.02%
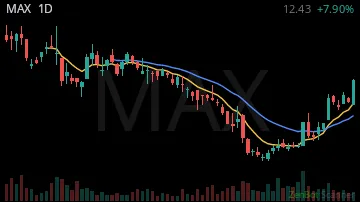
MAX11.68 +0.12%
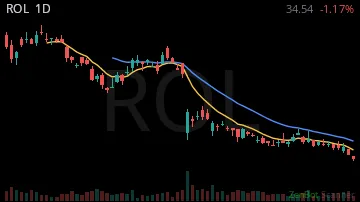
ROL33.89 +0.05%
AES14.94 0.00%

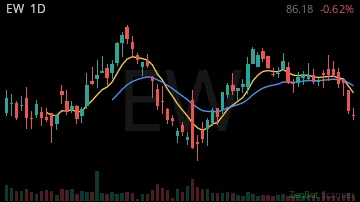
EW88.25 +0.03%
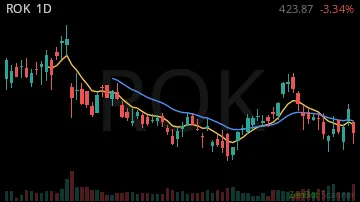
ROK422.03 -0.02%
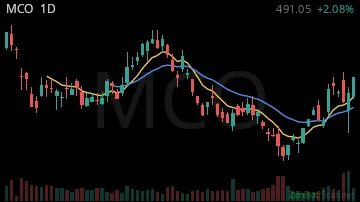
MCO483.00 +0.04%
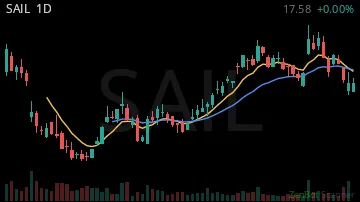
SAIL19.75 +0.02%
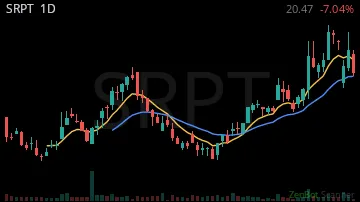
SRPT17.85 +0.08%
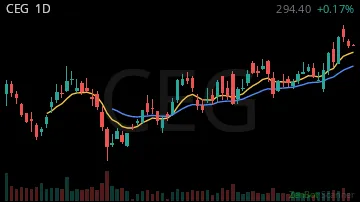
CEG276.00 -0.01%
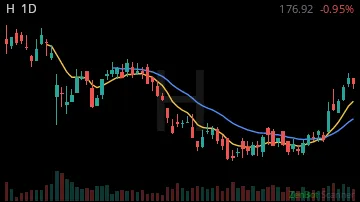
H167.50 +0.03%
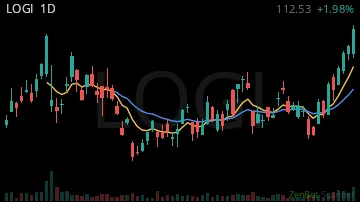
LOGI105.16 +0.02%
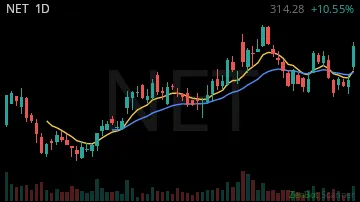
NET317.00 -0.09%
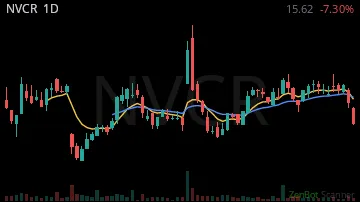
NVCR14.50 +0.01%
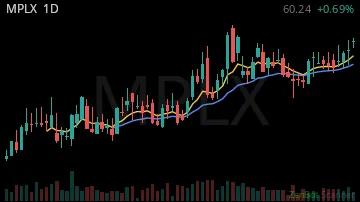
MPLX57.56 +0.01%
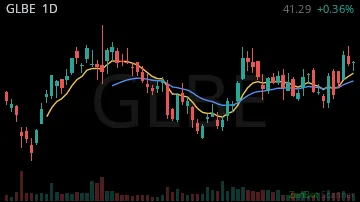
GLBE40.00 +0.03%
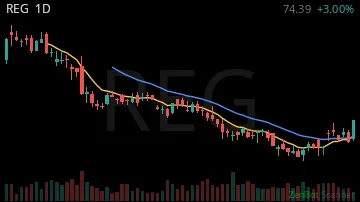
REG73.63 +0.03%
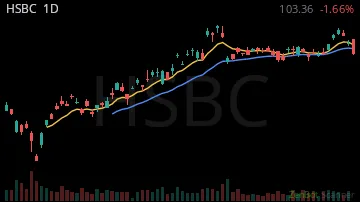
HSBC94.60 0.00%
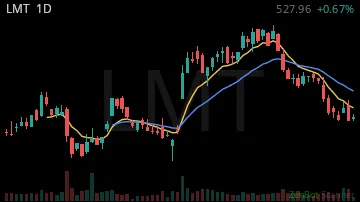
LMT532.00 +0.06%
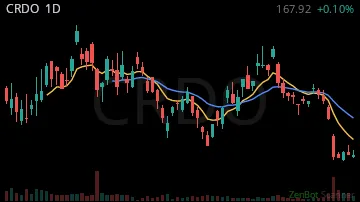
CRDO178.12 -0.01%
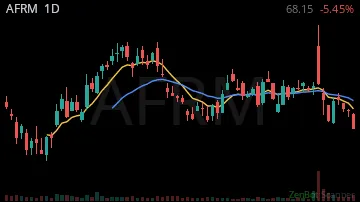
AFRM75.61 +0.07%
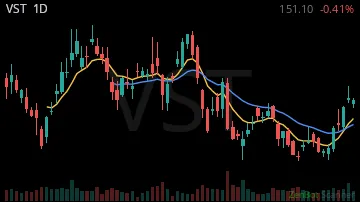
VST154.80 +0.02%
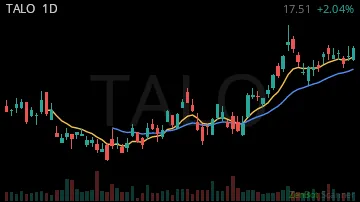
TALO16.98 0.00%
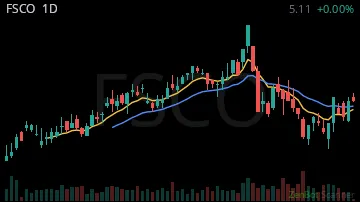
FSCO5.13 +0.04%
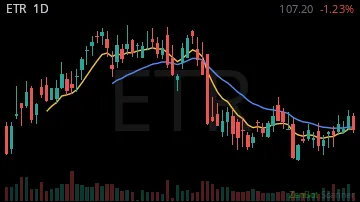
ETR103.96 -0.01%
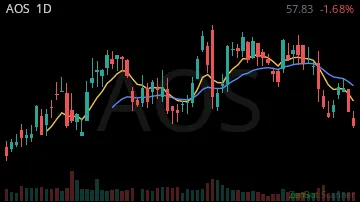
AOS59.47 +0.03%
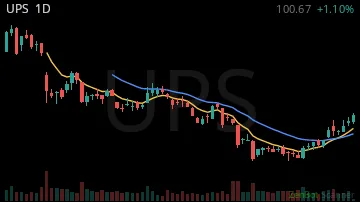
UPS97.79 +0.02%
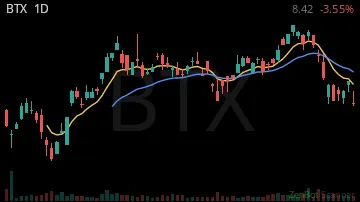
BTX8.69 -0.01%
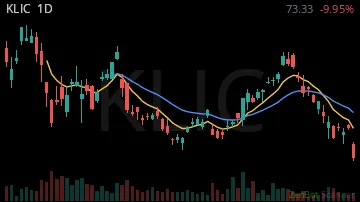
KLIC83.36 -0.06%
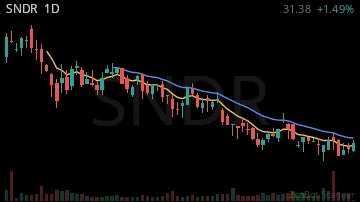
SNDR31.54 +0.01%
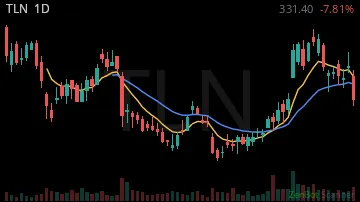
TLN351.51 -0.02%
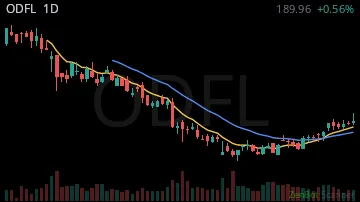
ODFL187.90 +0.03%
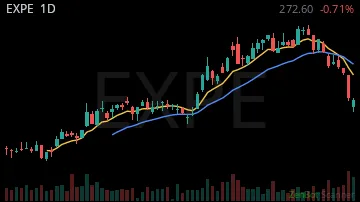
EXPE291.50 +0.07%
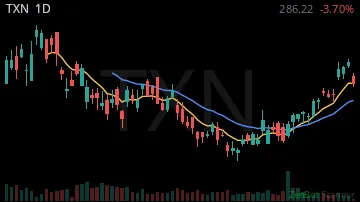
TXN277.75 -0.01%
JPM335.55 +0.01%

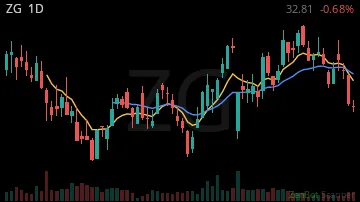
ZG32.45 +0.11%
DHI139.55 +0.04%

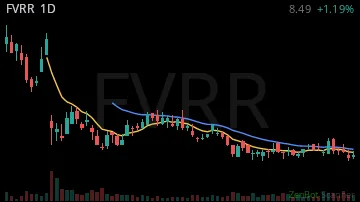
FVRR8.86 +0.03%
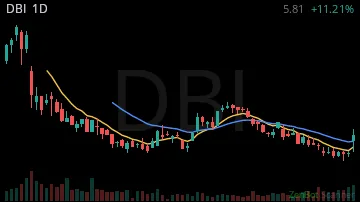
DBI6.42 +0.08%
XYZ79.14 +0.04%

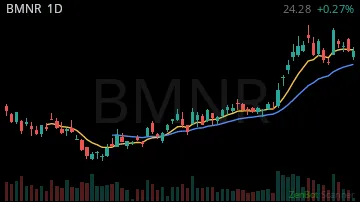
BMNR23.31 +0.05%
SNOW335.20 -0.06%

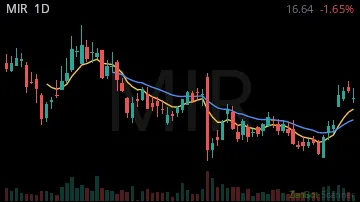
MIR15.81 -0.04%
| Symbol | Chart | Sector | Last | Chg % | Chg $ | RS 1H | RS 2W | RVOL | Vol |
|---|---|---|---|---|---|---|---|---|---|
| ERIC |  | Technology | 10.70 | +0.12% | +1.12 | 9.12 | 0.19 | 480% | 41.0M |
| MMED |  | Health Care | 17.82 | -0.03% | -0.58 | -13.34 | -3.06 | 435% | 27.7M |
| HOMB | 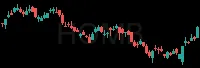 | Finance | 28.80 | +0.02% | +0.44 | 3.73 | -2.80 | 324% | 4.8M |
| SMTC | 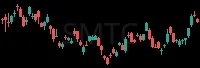 | Technology | 148.50 | -0.14% | -24.28 | -1.41 | -1.90 | 299% | 9.7M |
| DOCN | 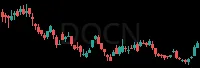 | Technology | 109.89 | +0.01% | +0.60 | -0.88 | -3.69 | 261% | 6.4M |
| VG | 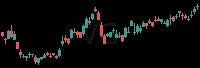 | Utilities | 12.55 | -0.05% | -0.72 | 0.77 | 0.00 | 253% | 33.9M |
| WCN | 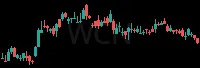 | Utilities | 165.51 | +0.06% | +8.69 | 1.54 | -0.43 | 252% | 4.4M |
| WM |  | Utilities | 220.00 | +0.02% | +4.25 | -5.13 | 2.10 | 248% | 5.2M |
| WSE | 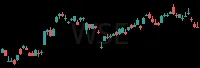 | Industrials | 12.21 | +0.02% | +0.20 | 0.00 | 1.01 | 233% | 3.6M |
| TSM | 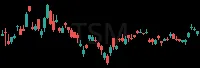 | Technology | 424.50 | -0.01% | -5.50 | 0.90 | -2.57 | 228% | 22.4M |
| NRIX | 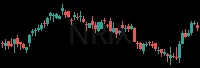 | Health Care | 25.06 | +0.13% | +2.93 | 3.43 | -1.99 | 225% | 3.8M |
| JCI |  | Industrials | 147.33 | -0.06% | -9.14 | -1.28 | 0.54 | 221% | 7.1M |
| BLK | 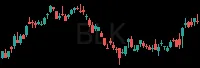 | Finance | 1112.55 | +0.04% | +38.76 | -3.23 | -0.53 | 219% | 1.2M |
| TT | 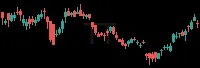 | Industrials | 447.79 | -0.05% | -23.50 | -6.59 | 1.04 | 218% | 2.4M |
| VICR | 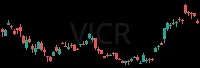 | Technology | 221.00 | -0.10% | -24.35 | 8.65 | -2.59 | 215% | 1.8M |
| SEI | 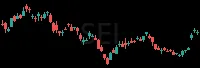 | Consumer Dis | 65.99 | -0.15% | -11.84 | 10.54 | 0.56 | 203% | 5.4M |
| OUST | 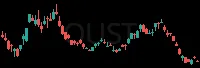 | Industrials | 31.54 | -0.11% | -3.79 | -1.99 | -4.18 | 201% | 4.9M |
| KMB | 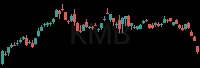 | Consumer Dis | 104.40 | +0.06% | +6.11 | 3.13 | -1.19 | 197% | 7.9M |
| REAL | 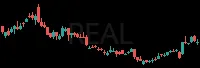 | Consumer Dis | 10.54 | +0.07% | +0.73 | 0.00 | 1.66 | 197% | 5.9M |
| VFC | 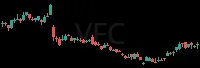 | Industrials | 17.25 | +0.05% | +0.77 | 4.10 | 2.64 | 196% | 15.5M |
| SANM | 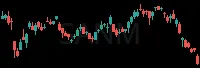 | Technology | 188.04 | -0.11% | -23.75 | -3.77 | -2.37 | 193% | 1.2M |
| VSAT |  | Consumer Dis | 62.28 | +0.01% | +0.55 | 1.89 | -2.83 | 192% | 3.4M |
| TRU | 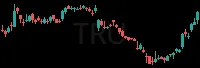 | Finance | 74.50 | +0.11% | +7.56 | 5.37 | -0.36 | 189% | 4.5M |
| GRFS | 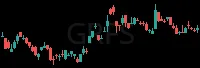 | Health Care | 7.56 | +0.05% | +0.39 | 3.74 | -2.30 | 188% | 907.1K |
| CPAY | 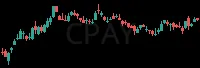 | Finance | 406.20 | +0.03% | +13.18 | 1.80 | -1.01 | 187% | 911.8K |
| BTI |  | Consumer Sta | 58.00 | +0.02% | +1.34 | 2.63 | 0.01 | 186% | 8.6M |
| AU | 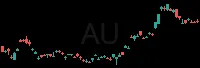 | Basic Materi | 91.51 | +0.03% | +2.67 | 5.46 | -2.08 | 185% | 4.7M |
| AMAT | 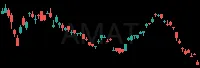 | Technology | 429.51 | -0.04% | -17.12 | -1.38 | -2.69 | 184% | 12.2M |
| TSCO | 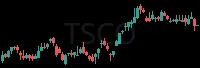 | Consumer Dis | 32.79 | 0.00% | +0.05 | -17.85 | 0.04 | 182% | 19.1M |
| ANET | 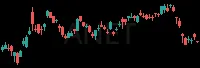 | Telecommunic | 185.99 | -0.05% | -9.43 | -0.15 | -1.98 | 182% | 10.3M |
| LXU | 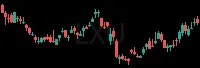 | Basic Materi | 10.99 | +0.07% | +0.76 | 9.34 | -0.12 | 182% | 1.4M |
| TER |  | Industrials | 343.99 | -0.04% | -15.45 | -0.83 | -2.68 | 181% | 4.5M |
| GEV | 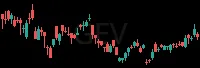 | Technology | 930.93 | -0.07% | -73.11 | 0.85 | 0.15 | 180% | 3.8M |
| CVS |  | Consumer Sta | 92.38 | +0.02% | +1.99 | 6.77 | 0.48 | 173% | 14.3M |
| BLCO | 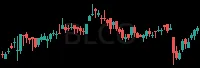 | Health Care | 16.66 | +0.04% | +0.62 | 2.82 | -2.39 | 172% | 898.9K |
| SCCO | 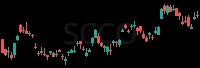 | Basic Materi | 203.00 | -0.02% | -4.42 | 3.21 | -0.56 | 172% | 1.8M |
| VIAV |  | Technology | 37.14 | -0.04% | -1.41 | 3.09 | -1.46 | 172% | 8.6M |
| USB | 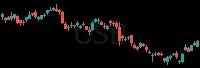 | Finance | 57.57 | +0.02% | +1.31 | 10.22 | -3.14 | 170% | 12.1M |
| CRBG | 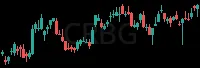 | Finance | 34.43 | +0.01% | +0.48 | 2.00 | -0.44 | 166% | 7.7M |
| SYF |  | Finance | 74.04 | +0.03% | +2.32 | 0.78 | -0.51 | 163% | 4.9M |
| LEVI |  | Consumer Dis | 20.63 | +0.06% | +1.15 | -1.12 | -1.53 | 162% | 5.4M |
| LRCX |  | Technology | 278.95 | -0.07% | -22.16 | 1.70 | -2.24 | 162% | 13.4M |
| QQQ | 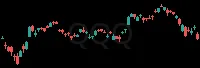 | 726.22 | 0.00% | -2.73 | -2.59 | -1.49 | 162% | 52.5M | |
| LITE | 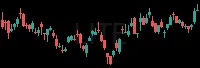 | Telecommunic | 876.92 | -0.11% | -111.07 | -0.16 | -0.47 | 161% | 7.6M |
| CLF | 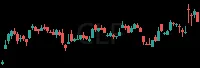 | Basic Materi | 12.16 | -0.03% | -0.42 | -0.47 | 1.48 | 161% | 24.3M |
| NXPI |  | Technology | 229.68 | +0.01% | +3.36 | -12.59 | -2.69 | 160% | 5.2M |
| AMX | 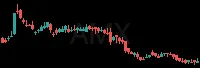 | Telecommunic | 22.43 | +0.03% | +0.59 | 1.20 | -0.33 | 160% | 5.1M |
| PTON | 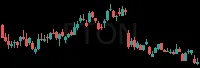 | Consumer Dis | 5.26 | +0.01% | +0.04 | -6.83 | 0.46 | 158% | 14.0M |
| SATA | 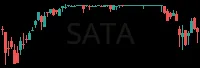 | Technology | 98.60 | 0.00% | -0.19 | -7.41 | -4.50 | 155% | 723.6K |
| ING | 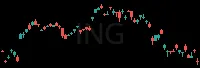 | Finance | 33.19 | -0.01% | -0.44 | -3.95 | -5.40 | 154% | 3.3M |
| URI |  | Consumer Dis | 1047.00 | +0.01% | +12.19 | 3.16 | -0.90 | 153% | 701.1K |
| PRVA | 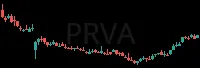 | Health Care | 22.50 | +0.04% | +0.85 | -12.70 | 2.00 | 153% | 2.0M |
| TWST | 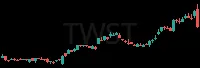 | Health Care | 144.50 | -0.02% | -3.66 | -1.87 | -2.55 | 153% | 3.5M |
| HIMS | 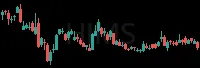 | Health Care | 29.15 | -0.02% | -0.56 | -1.41 | -0.94 | 149% | 16.3M |
| ENR | 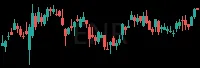 | Miscellaneou | 22.00 | 0.00% | +0.08 | 0.77 | -1.17 | 149% | 1.7M |
| PWR | 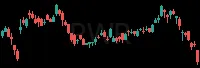 | Industrials | 644.21 | -0.06% | -44.67 | 13.05 | 0.52 | 148% | 1.4M |
| WFC | 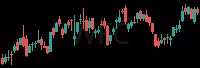 | Finance | 82.85 | +0.02% | +1.95 | -13.80 | -0.59 | 147% | 20.3M |
| ET | 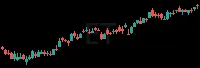 | Utilities | 20.00 | -0.02% | -0.48 | -0.13 | -0.39 | 146% | 12.5M |
| MAX | 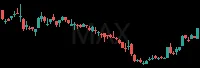 | Consumer Dis | 11.68 | +0.12% | +1.21 | -1.15 | 1.32 | 146% | 1.5M |
| ROL |  | Consumer Dis | 33.89 | +0.05% | +1.74 | 3.33 | 1.38 | 144% | 9.3M |
| AES |  | Industrials | 14.94 | 0.00% | -0.02 | -13.05 | 1.22 | 143% | 11.5M |
| EW | 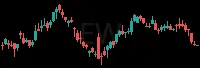 | Health Care | 88.25 | +0.03% | +2.98 | 5.25 | -1.59 | 143% | 4.7M |
| ROK |  | Industrials | 422.03 | -0.02% | -10.26 | 1.47 | -1.30 | 141% | 1.3M |
| MCO |  | Finance | 483.00 | +0.04% | +18.87 | 0.99 | -1.59 | 140% | 1.0M |
| SAIL |  | Technology | 19.75 | +0.02% | +0.38 | -4.50 | -2.31 | 138% | 6.1M |
| SRPT | 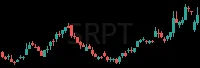 | Health Care | 17.85 | +0.08% | +1.34 | 13.42 | -3.97 | 137% | 4.0M |
| CEG | 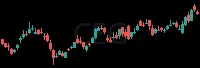 | Utilities | 276.00 | -0.01% | -3.54 | 2.15 | 0.49 | 136% | 4.4M |
| H | 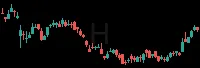 | Consumer Dis | 167.50 | +0.03% | +4.58 | -6.58 | -0.03 | 135% | 1.0M |
| LOGI |  | Technology | 105.16 | +0.02% | +2.39 | -0.94 | -0.42 | 134% | 1.1M |
| NET | 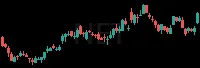 | Technology | 317.00 | -0.09% | -30.70 | -7.51 | -1.20 | 134% | 4.5M |
| NVCR | 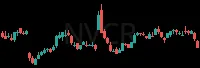 | Health Care | 14.50 | +0.01% | +0.20 | 16.94 | -3.43 | 134% | 1.8M |
| MPLX | 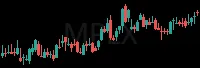 | Energy | 57.56 | +0.01% | +0.65 | 13.41 | -1.01 | 133% | 1.7M |
| GLBE |  | Technology | 40.00 | +0.03% | +1.00 | -15.44 | -1.96 | 133% | 1.9M |
| REG | 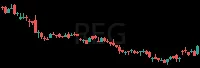 | Real Estate | 73.63 | +0.03% | +1.98 | 4.02 | -2.68 | 132% | 1.7M |
| HSBC | 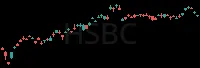 | Finance | 94.60 | 0.00% | -0.25 | 12.30 | -4.38 | 132% | 1.9M |
| LMT |  | Industrials | 532.00 | +0.06% | +27.98 | -0.25 | -2.82 | 131% | 1.4M |
| CRDO |  | Technology | 178.12 | -0.01% | -1.11 | -4.77 | -1.48 | 131% | 9.9M |
| AFRM |  | Finance | 75.61 | +0.07% | +5.10 | -4.44 | 0.33 | 130% | 5.9M |
| VST | 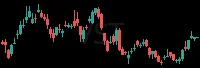 | Utilities | 154.80 | +0.02% | +3.01 | 1.70 | 0.88 | 130% | 7.2M |
| TALO |  | Energy | 16.98 | 0.00% | -0.05 | 4.28 | 0.37 | 129% | 3.1M |
| FSCO | 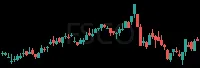 | Finance | 5.13 | +0.04% | +0.19 | 0.00 | -2.71 | 129% | 1.2M |
| ETR | 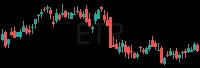 | Utilities | 103.96 | -0.01% | -1.03 | 5.32 | 2.42 | 129% | 3.4M |
| AOS | 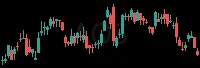 | Consumer Dis | 59.47 | +0.03% | +1.64 | 7.36 | -1.04 | 128% | 1.8M |
| UPS | 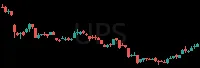 | Industrials | 97.79 | +0.02% | +2.01 | 1.49 | 0.33 | 128% | 5.9M |
| BTX | 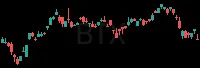 | 8.69 | -0.01% | -0.08 | -1.51 | -1.09 | 127% | 579.8K | |
| KLIC | 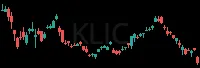 | Technology | 83.36 | -0.06% | -5.18 | 8.87 | -1.81 | 126% | 940.2K |
| SNDR | 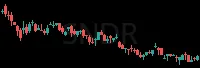 | Industrials | 31.54 | +0.01% | +0.34 | 4.95 | -1.17 | 126% | 1.3M |
| TLN | 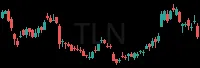 | Utilities | 351.51 | -0.02% | -6.91 | -5.69 | 2.05 | 126% | 1.2M |
| ODFL | 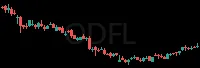 | Industrials | 187.90 | +0.03% | +4.73 | 0.48 | 1.12 | 126% | 2.2M |
| EXPE | 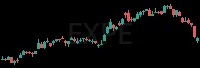 | Consumer Dis | 291.50 | +0.07% | +18.06 | -11.57 | -0.13 | 125% | 2.4M |
| TXN |  | Technology | 277.75 | -0.01% | -2.90 | -1.52 | -0.35 | 124% | 6.9M |
| JPM | 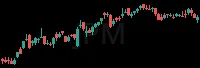 | Finance | 335.55 | +0.01% | +4.12 | -3.67 | -3.18 | 124% | 8.7M |
| ZG | 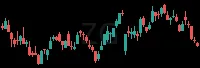 | Consumer Dis | 32.45 | +0.11% | +3.18 | 1.18 | 0.39 | 124% | 1.3M |
| DHI | 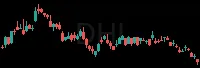 | Consumer Dis | 139.55 | +0.04% | +5.91 | 0.96 | -2.14 | 123% | 3.2M |
| FVRR | 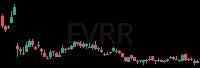 | Consumer Dis | 8.86 | +0.03% | +0.26 | -3.67 | -0.89 | 123% | 945.4K |
| DBI | 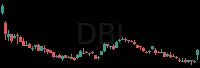 | Consumer Dis | 6.42 | +0.08% | +0.47 | -0.99 | -1.97 | 123% | 894.7K |
| XYZ |  | Technology | 79.14 | +0.04% | +3.29 | -3.96 | 0.69 | 122% | 5.5M |
| BMNR | 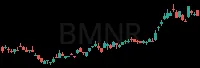 | Finance | 23.31 | +0.05% | +1.06 | -1.25 | -4.08 | 121% | 46.6M |
| SNOW |  | Technology | 335.20 | -0.06% | -22.56 | 3.05 | 0.47 | 120% | 5.7M |
| MIR | 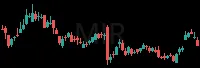 | Industrials | 15.81 | -0.04% | -0.61 | 2.37 | -0.03 | 120% | 4.6M |
RS = relative strength vs SPY, in ATRs (1 hour / 2 weeks); green leads the market, red lags. RVOL = today's volume vs average. Prices are 15-minute delayed.
New here? How to trade these scans · More Pullbacks+Levels scans: Leaders on Sale · Bullish Pullback - Long · VWAP Pullbacks - Long · Bull Flag - Long · Near Day High · Open Air - Long · Near Open Air - Long