All scans · Long
Near Day High
Open live →ZenBot is a free real-time scanner that surfaces the stocks in play — heavy volume, leading their sector, moving before the crowd. This is one of its built-in scans.
TTMI80.17 +0.08%

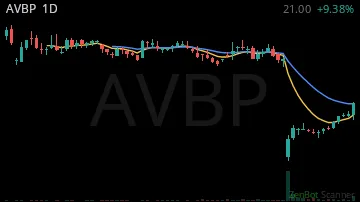
AVBP21.00 +0.09%
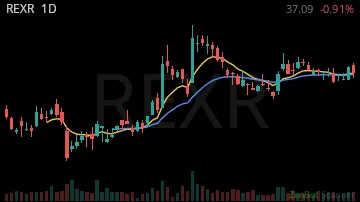
REXR38.72 +0.07%
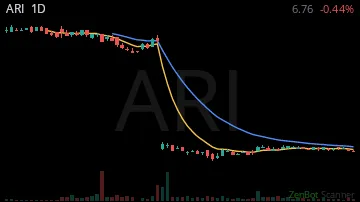
ARI6.43 +0.02%
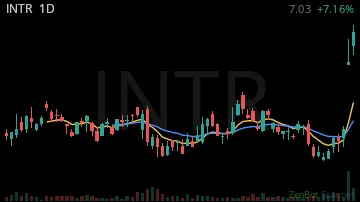
INTR7.19 +0.07%
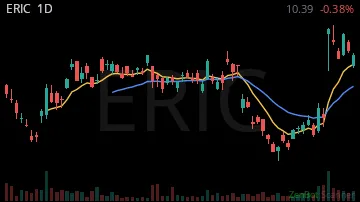
ERIC10.66 +0.03%
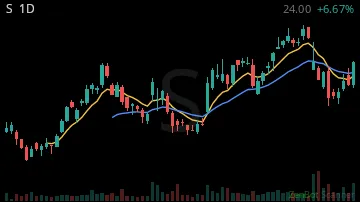
S23.99 +0.07%
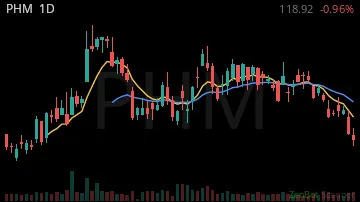
PHM121.18 +0.01%
BYD71.64 -0.01%

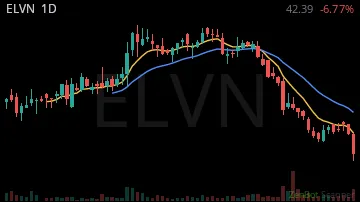
ELVN41.54 -0.01%
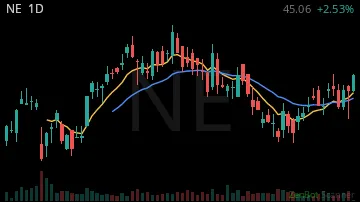
NE47.73 +0.09%
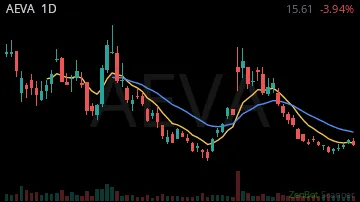
AEVA10.18 +0.03%
CBOE340.41 +0.04%

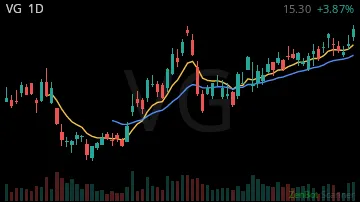
VG14.01 +0.09%
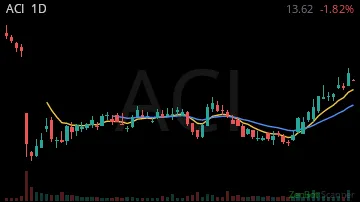
ACI13.95 +0.01%
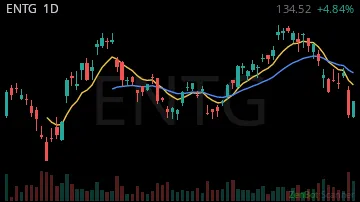
ENTG134.55 +0.05%
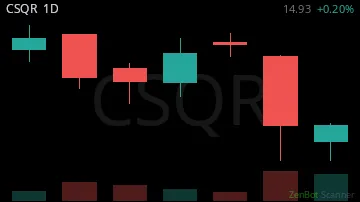
CSQR14.92 0.00%
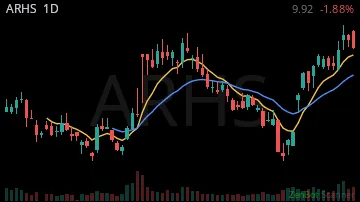
ARHS11.70 +0.01%
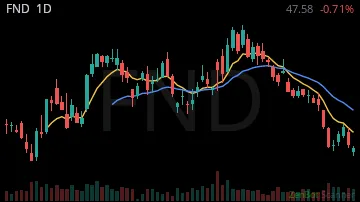
FND47.82 -0.01%
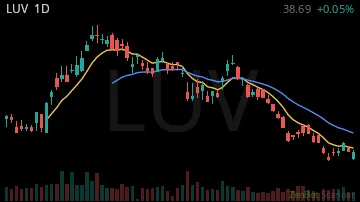
LUV41.75 -0.01%
NTST17.32 +0.02%

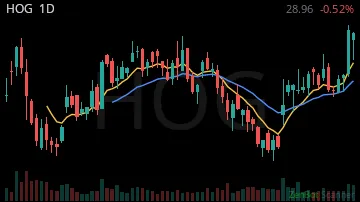
HOG28.94 -0.01%
RPRX63.85 0.00%

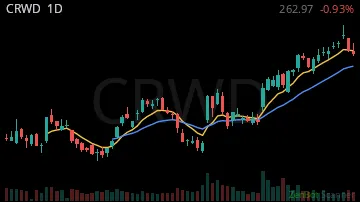
CRWD257.60 +0.08%
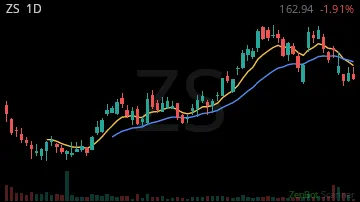
ZS255.32 +0.07%
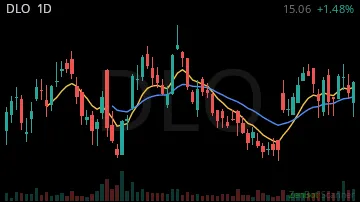
DLO15.05 +0.01%
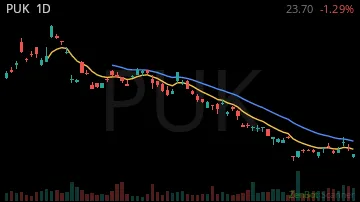
PUK23.70 -0.01%
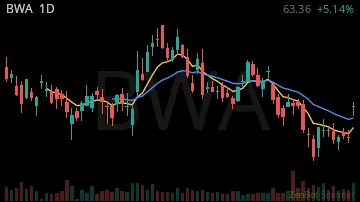
BWA54.93 -0.01%
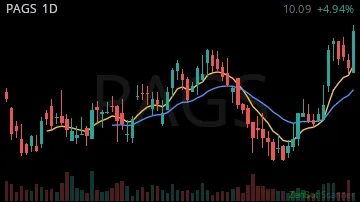
PAGS11.44 +0.01%
| Symbol | Chart | Sector | Last | Chg % | Chg $ | RS 1H | RS 2W | RVOL | Vol |
|---|---|---|---|---|---|---|---|---|---|
| TTMI | 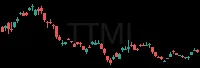 | Technology | 80.17 | +0.08% | +6.28 | 0.00 | -3.17 | 296% | 8.6M |
| AVBP | 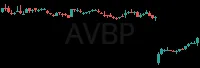 | Health Care | 21.00 | +0.09% | +1.80 | 0.00 | 5.09 | 262% | 3.3M |
| REXR | 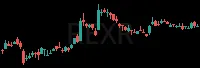 | Real Estate | 38.72 | +0.07% | +2.44 | 0.00 | 1.59 | 257% | 7.1M |
| ARI |  | Real Estate | 6.43 | +0.02% | +0.13 | 0.00 | 2.58 | 233% | 7.1M |
| INTR | 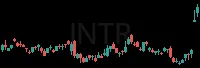 | Finance | 7.19 | +0.07% | +0.45 | 0.00 | 1.34 | 232% | 16.4M |
| ERIC | 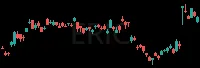 | Technology | 10.66 | +0.03% | +0.28 | 0.00 | 5.43 | 184% | 17.4M |
| S | 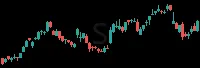 | Technology | 23.99 | +0.07% | +1.49 | 0.00 | -0.58 | 183% | 18.4M |
| PHM | 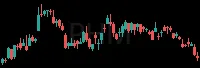 | Consumer Dis | 121.18 | +0.01% | +1.70 | 0.00 | 3.02 | 183% | 3.2M |
| BYD | 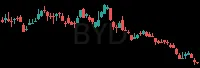 | Consumer Dis | 71.64 | -0.01% | -0.63 | 0.00 | 3.18 | 180% | 1.9M |
| ELVN | 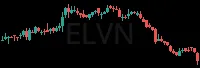 | Health Care | 41.54 | -0.01% | -0.39 | 0.00 | 1.90 | 177% | 2.3M |
| NE | 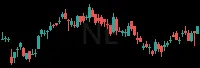 | Energy | 47.73 | +0.09% | +3.78 | 0.00 | 3.76 | 176% | 2.0M |
| AEVA | 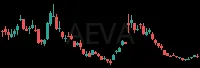 | Consumer Dis | 10.18 | +0.03% | +0.30 | 0.00 | -3.15 | 162% | 2.5M |
| CBOE |  | Finance | 340.41 | +0.04% | +12.69 | 0.00 | 6.47 | 161% | 1.9M |
| VG | 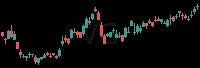 | Utilities | 14.01 | +0.09% | +1.20 | 0.00 | 1.13 | 160% | 22.6M |
| ACI | 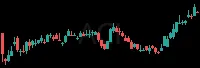 | Consumer Sta | 13.95 | +0.01% | +0.08 | 0.00 | 7.22 | 157% | 12.6M |
| ENTG | 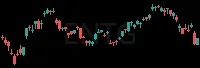 | Industrials | 134.55 | +0.05% | +6.24 | 0.00 | -2.19 | 151% | 3.3M |
| CSQR |  | Technology | 14.92 | 0.00% | +0.02 | 0.00 | 0.00 | 151% | 3.1M |
| ARHS | 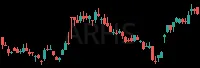 | Consumer Dis | 11.70 | +0.01% | +0.17 | 0.00 | 5.28 | 146% | 2.1M |
| FND | 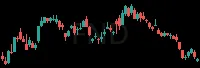 | Consumer Dis | 47.82 | -0.01% | -0.35 | 0.00 | 2.77 | 145% | 3.7M |
| LUV | 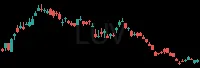 | Industrials | 41.75 | -0.01% | -0.29 | 0.00 | 1.87 | 140% | 8.2M |
| NTST | 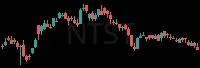 | Real Estate | 17.32 | +0.02% | +0.30 | 0.00 | 0.81 | 136% | 2.5M |
| HOG | 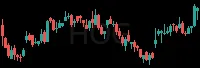 | Consumer Dis | 28.94 | -0.01% | -0.17 | 0.00 | 4.52 | 135% | 2.5M |
| RPRX | 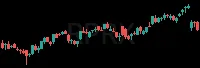 | Health Care | 63.85 | 0.00% | +0.10 | 0.00 | 7.16 | 134% | 4.0M |
| CRWD | 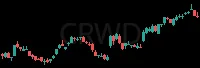 | Technology | 257.60 | +0.08% | +19.66 | 0.00 | -1.11 | 130% | 13.4M |
| ZS | 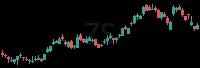 | Technology | 255.32 | +0.07% | +17.56 | 0.00 | 4.33 | 129% | 4.0M |
| DLO | 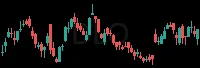 | Consumer Dis | 15.05 | +0.01% | +0.21 | 0.00 | 2.76 | 129% | 2.8M |
| PUK | 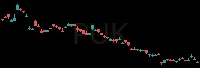 | Finance | 23.70 | -0.01% | -0.31 | 0.00 | 0.71 | 127% | 1.5M |
| BWA | 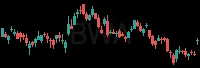 | Consumer Dis | 54.93 | -0.01% | -0.53 | 0.00 | -2.53 | 126% | 3.0M |
| PAGS | 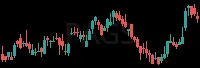 | Technology | 11.44 | +0.01% | +0.16 | 0.00 | 3.44 | 126% | 4.5M |
RS = relative strength vs SPY, in ATRs (1 hour / 2 weeks); green leads the market, red lags. RVOL = today's volume vs average. Prices are 15-minute delayed.
New here? How to trade these scans · More Pullbacks+Levels scans: Leaders on Sale · Bullish Pullback - Long · Strong Sector Pullback · VWAP Pullbacks - Long · Bull Flag - Long · SMA Magnet - Long