All scans · Short
Volume Building - Short
Open live →Relative Volume slope rising · Relative Volume > .8
ZenBot is a free real-time scanner that surfaces the stocks in play — heavy volume, leading their sector, moving before the crowd. This is one of its built-in scans.
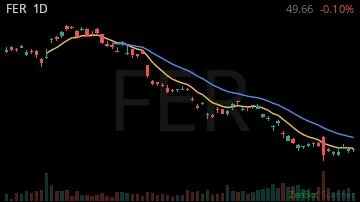
FER48.87 -0.03%
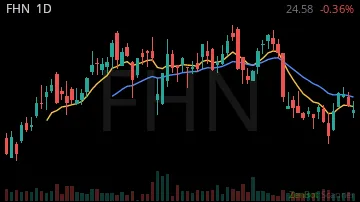
FHN22.96 +0.01%
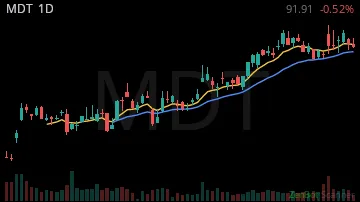
MDT95.22 +0.02%
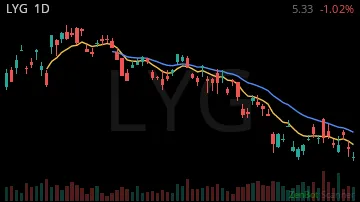
LYG5.47 -0.01%
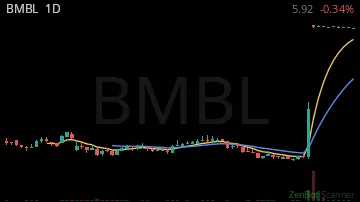
BMBL5.93 -0.01%
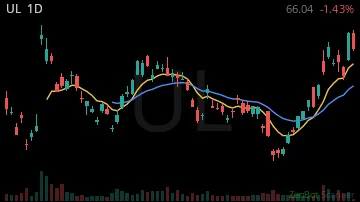
UL64.65 +0.01%
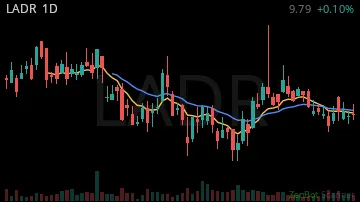
LADR8.94 +0.02%
SKM33.00 -0.04%

APO112.58 -0.01%

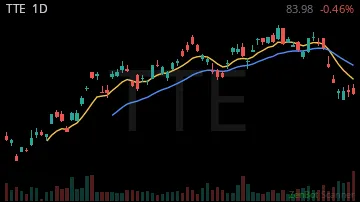
TTE89.63 0.00%
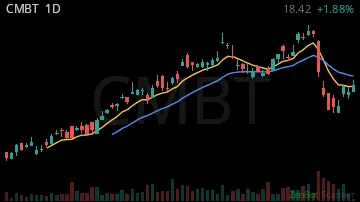
CMBT17.92 -0.06%
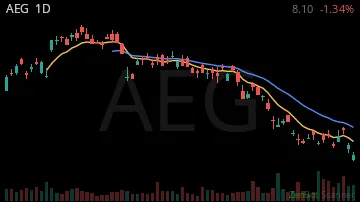
AEG8.28 0.00%
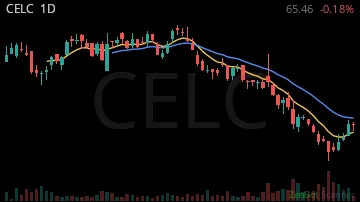
CELC60.30 +0.01%
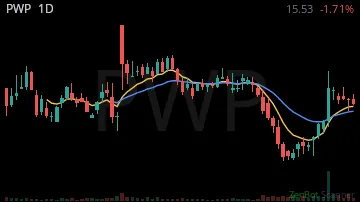
PWP13.23 -0.18%
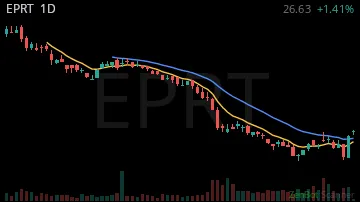
EPRT25.96 +0.01%
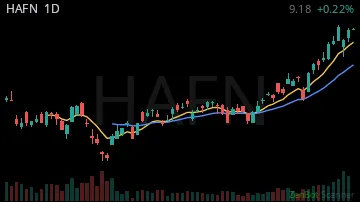
HAFN10.10 -0.07%
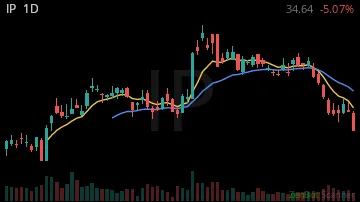
IP34.08 +0.07%
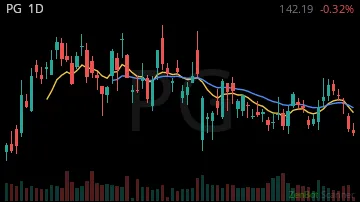
PG157.00 +0.03%
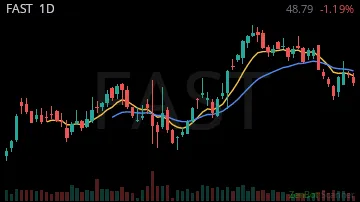
FAST50.38 -0.02%
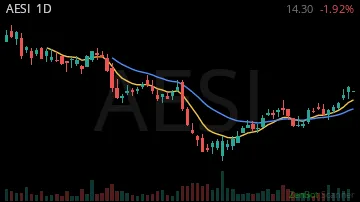
AESI10.36 -0.06%
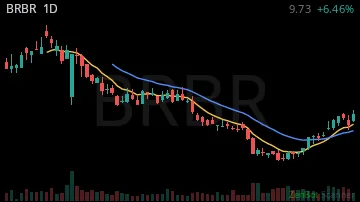
BRBR9.00 +0.04%
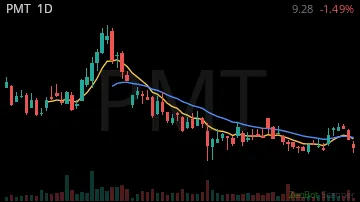
PMT7.08 +0.01%
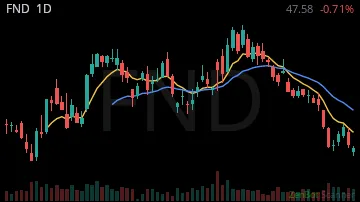
FND46.86 +0.05%
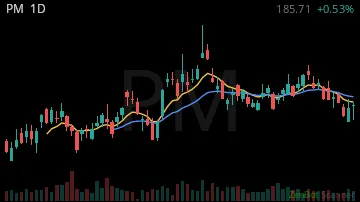
PM199.90 0.00%
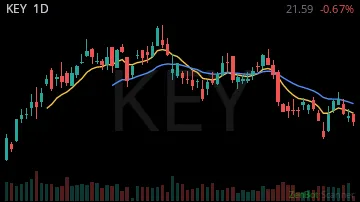
KEY19.94 0.00%
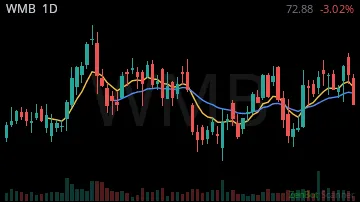
WMB69.32 -0.05%
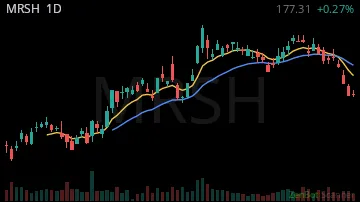
MRSH186.54 +0.05%
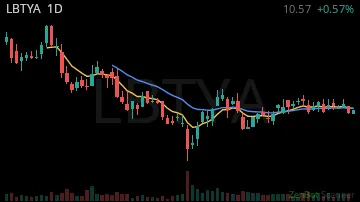
LBTYA8.10 -0.05%
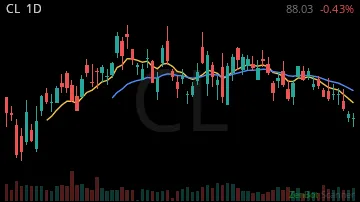
CL92.82 0.00%
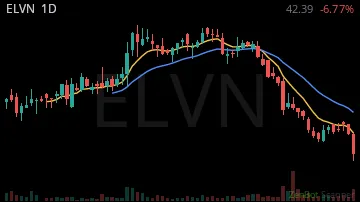
ELVN39.49 +0.01%
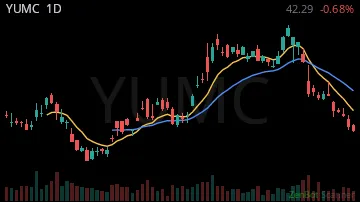
YUMC44.67 +0.03%
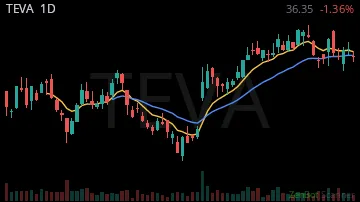
TEVA41.11 +0.01%
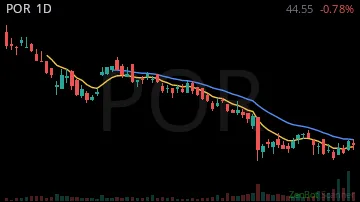
POR43.93 -0.01%
ABBV283.70 0.00%

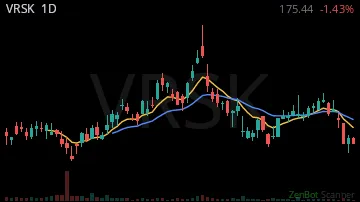
VRSK187.56 +0.04%
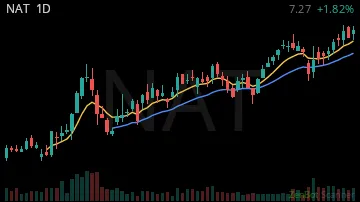
NAT7.85 -0.11%
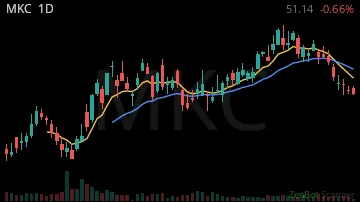
MKC45.99 +0.03%
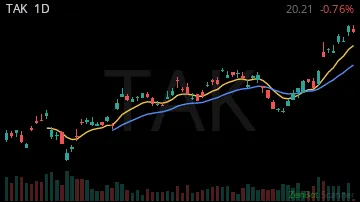
TAK19.47 +0.02%
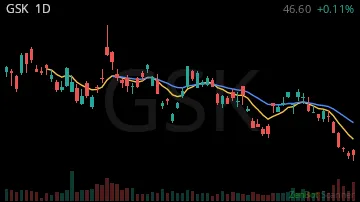
GSK49.02 +0.06%
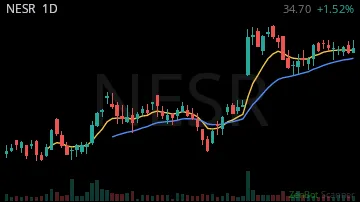
NESR19.13 -0.09%
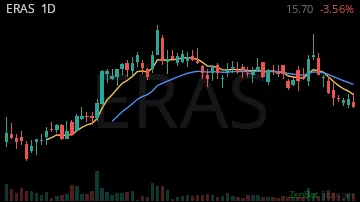
ERAS14.87 +0.01%
GNL7.47 -0.03%

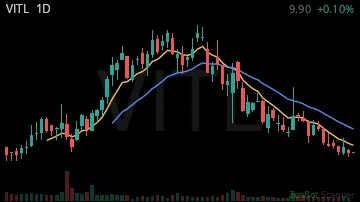
VITL8.62 -0.03%
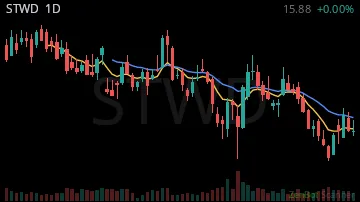
STWD12.72 +0.02%
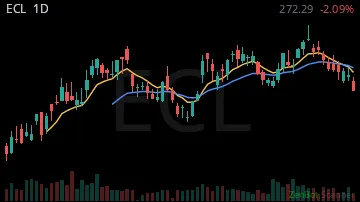
ECL290.76 +0.01%
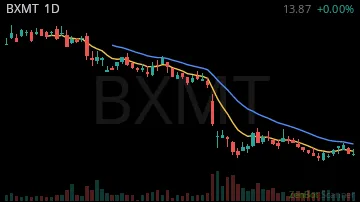
BXMT10.85 +0.03%
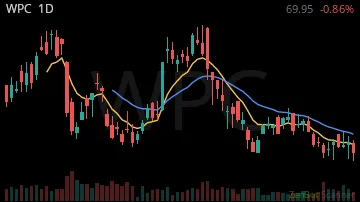
WPC64.45 +0.01%
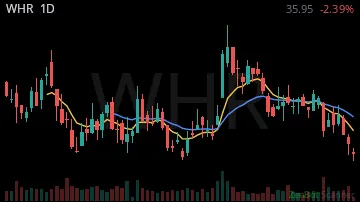
WHR28.25 +0.02%
BJ103.27 0.00%

CHD103.08 0.00%
COST978.06 0.00%

CRGY12.53 -0.02%

AMGN434.90 +0.02%
SO89.18 +0.01%
BNL18.20 +0.01%
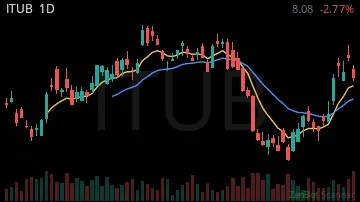
ITUB9.50 -0.04%
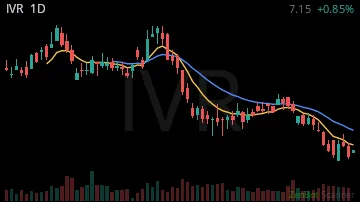
IVR5.67 +0.01%
ORI38.67 +0.01%

NOMD11.45 0.00%

GILD157.68 +0.07%

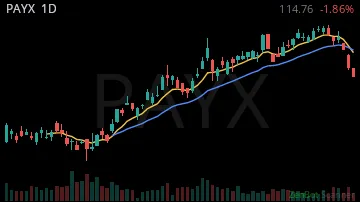
PAYX110.50 +0.04%
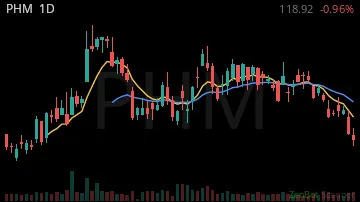
PHM113.08 +0.01%
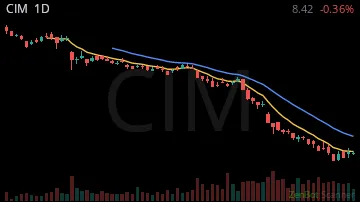
CIM8.55 +0.01%
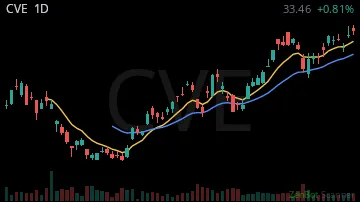
CVE32.44 -0.01%
AEP123.54 -0.02%

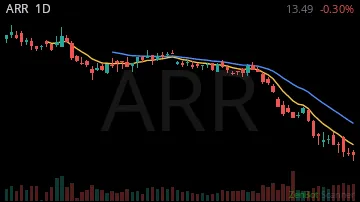
ARR13.64 0.00%
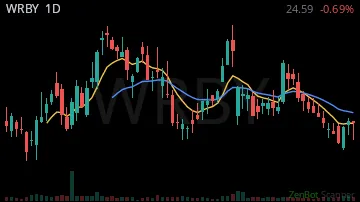
WRBY24.64 -0.01%
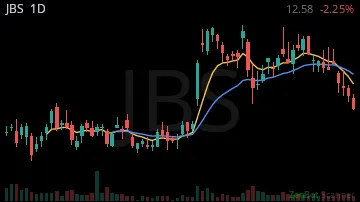
JBS12.85 -0.01%
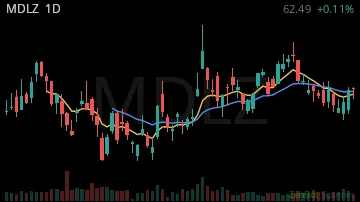
MDLZ63.03 +0.02%
KR62.71 +0.03%

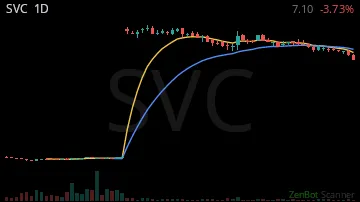
SVC6.37 +0.09%
BMRN56.11 +0.02%

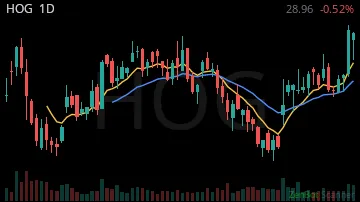
HOG28.25 +0.03%
ORC5.24 +0.04%

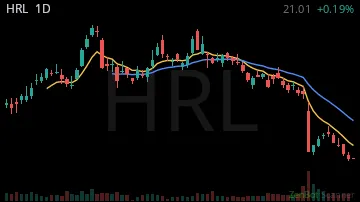
HRL20.23 +0.05%
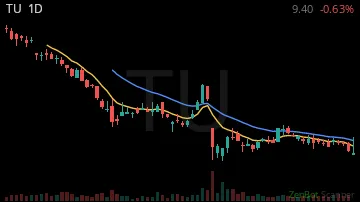
TU8.36 +0.03%
MO73.76 +0.03%

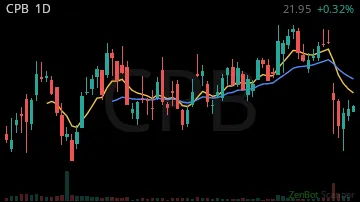
CPB19.85 +0.04%
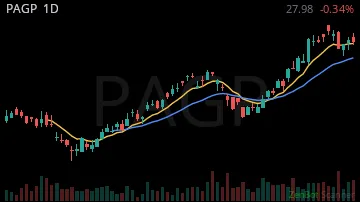
PAGP27.18 0.00%
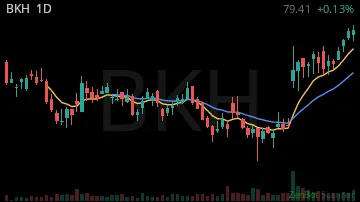
BKH75.87 -0.01%
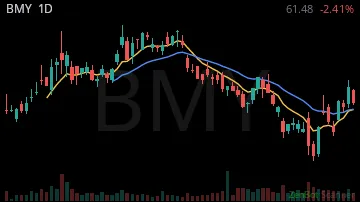
BMY61.00 +0.03%
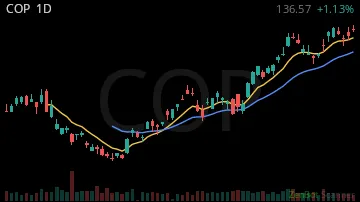
COP141.00 -0.01%
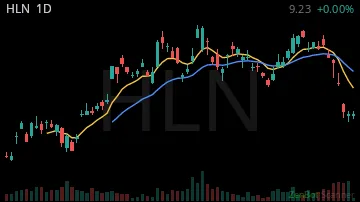
HLN9.85 +0.04%
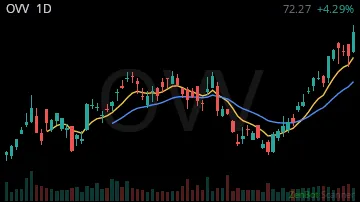
OVV66.13 -0.01%
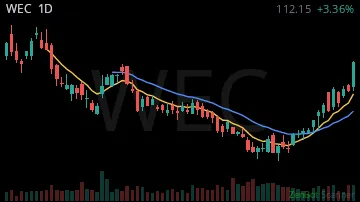
WEC105.97 -0.01%
GPCR21.75 -0.03%

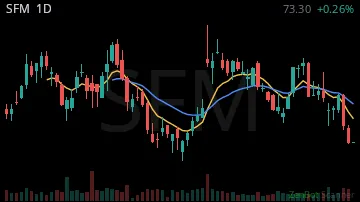
SFM66.00 +0.04%
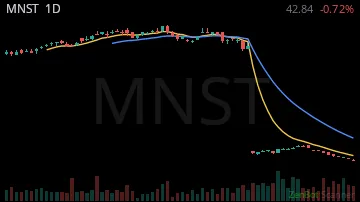
MNST45.26 +0.05%
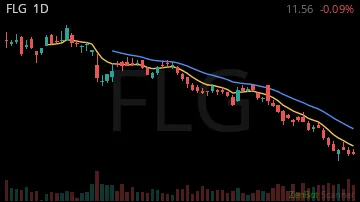
FLG11.08 -0.01%
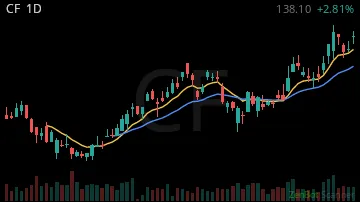
CF119.80 0.00%
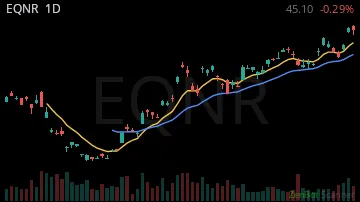
EQNR44.10 -0.03%
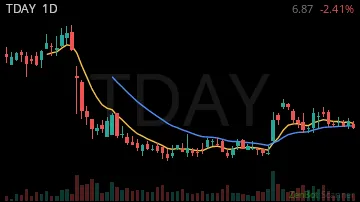
TDAY7.18 0.00%
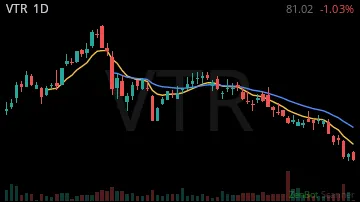
VTR84.59 0.00%
TRI107.89 +0.02%

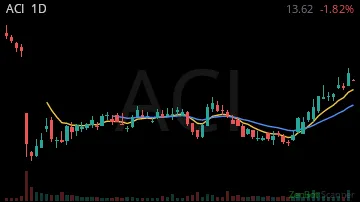
ACI13.02 0.00%
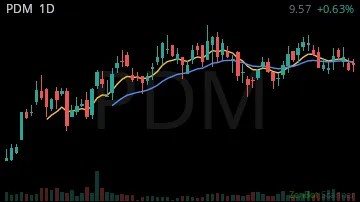
PDM8.98 -0.01%
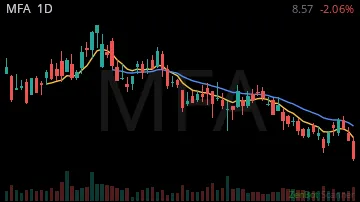
MFA6.73 0.00%
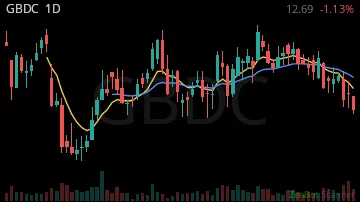
GBDC12.40 +0.03%
UGP7.61 -0.03%

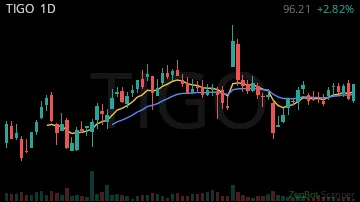
TIGO82.07 +0.02%
| Symbol | Chart | Sector | Last | Chg % | Chg $ | RS 1H | RS 2W | RVOL | Vol |
|---|---|---|---|---|---|---|---|---|---|
| FER |  | Industrials | 48.87 | -0.03% | -1.69 | -2.56 | -5.94 | 362% | 5.7M |
| FHN |  | Finance | 22.96 | +0.01% | +0.19 | 6.91 | -2.85 | 358% | 18.5M |
| MDT |  | Health Care | 95.22 | +0.02% | +2.21 | -8.69 | 0.65 | 293% | 50.2M |
| LYG |  | Finance | 5.47 | -0.01% | -0.03 | 1.00 | -3.48 | 267% | 38.0M |
| BMBL | 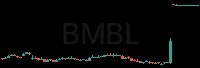 | Technology | 5.93 | -0.01% | -0.04 | -1.81 | 8.95 | 253% | 16.0M |
| UL |  | Consumer Dis | 64.65 | +0.01% | +0.79 | 3.63 | 0.70 | 244% | 7.8M |
| LADR | 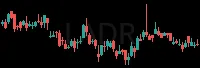 | Real Estate | 8.94 | +0.02% | +0.20 | 3.95 | -2.82 | 233% | 3.0M |
| SKM |  | Telecommunic | 33.00 | -0.04% | -1.42 | 7.47 | -2.81 | 232% | 3.5M |
| APO |  | Finance | 112.58 | -0.01% | -0.81 | -1.90 | -2.21 | 225% | 7.0M |
| TTE |  | Energy | 89.63 | 0.00% | -0.01 | 13.30 | -1.00 | 207% | 3.7M |
| CMBT | 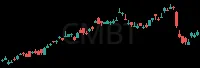 | Consumer Dis | 17.92 | -0.06% | -1.07 | 0.91 | -0.73 | 203% | 2.5M |
| AEG |  | Finance | 8.28 | 0.00% | +0.04 | -1.48 | -5.43 | 200% | 11.5M |
| CELC | 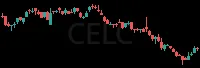 | Health Care | 60.30 | +0.01% | +0.40 | -4.41 | -4.55 | 199% | 2.1M |
| PWP | 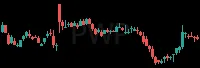 | Finance | 13.23 | -0.18% | -2.87 | -6.40 | 0.73 | 199% | 3.3M |
| EPRT |  | Real Estate | 25.96 | +0.01% | +0.31 | -2.93 | -2.32 | 198% | 6.0M |
| HAFN | 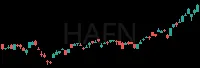 | Consumer Dis | 10.10 | -0.07% | -0.75 | 0.05 | 3.86 | 194% | 4.6M |
| IP | 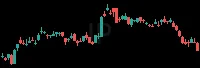 | Basic Materi | 34.08 | +0.07% | +2.27 | 3.56 | -4.68 | 192% | 9.0M |
| PG |  | Consumer Dis | 157.00 | +0.03% | +3.96 | -16.67 | 1.61 | 191% | 16.4M |
| FAST |  | Consumer Dis | 50.38 | -0.02% | -1.05 | -1.95 | -0.08 | 189% | 13.5M |
| AESI | 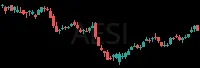 | Industrials | 10.36 | -0.06% | -0.71 | 15.07 | -2.42 | 189% | 6.1M |
| BRBR | 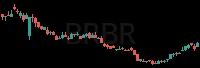 | Consumer Sta | 9.00 | +0.04% | +0.34 | -0.54 | 1.70 | 186% | 6.6M |
| PMT |  | Real Estate | 7.08 | +0.01% | +0.04 | 12.75 | -5.47 | 185% | 3.4M |
| FND | 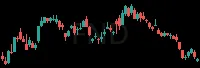 | Consumer Dis | 46.86 | +0.05% | +2.14 | 13.35 | -2.43 | 181% | 4.3M |
| PM |  | Consumer Sta | 199.90 | 0.00% | +0.61 | 2.72 | 0.96 | 180% | 8.0M |
| KEY |  | Finance | 19.94 | 0.00% | +0.03 | 13.30 | -2.98 | 179% | 23.0M |
| WMB |  | Utilities | 69.32 | -0.05% | -3.48 | -0.50 | 1.55 | 177% | 12.7M |
| MRSH | 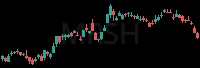 | Finance | 186.54 | +0.05% | +9.53 | 2.59 | 0.69 | 175% | 4.2M |
| LBTYA | 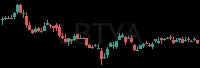 | Telecommunic | 8.10 | -0.05% | -0.45 | 6.92 | -3.97 | 175% | 4.9M |
| CL |  | Consumer Dis | 92.82 | 0.00% | +0.04 | 2.63 | 3.55 | 174% | 8.2M |
| ELVN |  | Health Care | 39.49 | +0.01% | +0.21 | -3.44 | -4.26 | 173% | 2.1M |
| YUMC | 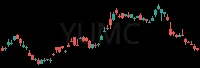 | Consumer Dis | 44.67 | +0.03% | +1.47 | 0.00 | 1.95 | 172% | 2.5M |
| TEVA |  | Health Care | 41.11 | +0.01% | +0.39 | 7.79 | 0.98 | 171% | 9.4M |
| POR | 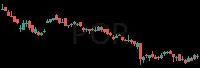 | Utilities | 43.93 | -0.01% | -0.65 | 11.15 | -3.16 | 170% | 2.5M |
| ABBV |  | Health Care | 283.70 | 0.00% | +0.22 | 8.58 | 1.88 | 168% | 7.6M |
| VRSK |  | Technology | 187.56 | +0.04% | +6.98 | 1.39 | 2.26 | 166% | 2.0M |
| NAT |  | Consumer Dis | 7.85 | -0.11% | -0.94 | 1.05 | 2.06 | 165% | 7.4M |
| MKC |  | Consumer Sta | 45.99 | +0.03% | +1.35 | 13.57 | -3.39 | 164% | 5.3M |
| TAK |  | Health Care | 19.47 | +0.02% | +0.46 | 0.34 | -0.30 | 163% | 4.4M |
| GSK |  | Health Care | 49.02 | +0.06% | +2.75 | 0.00 | -4.72 | 162% | 6.1M |
| NESR | 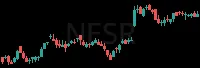 | Energy | 19.13 | -0.09% | -1.90 | -12.27 | -7.85 | 161% | 3.8M |
| ERAS |  | Health Care | 14.87 | +0.01% | +0.17 | -4.28 | -0.02 | 160% | 8.5M |
| GNL | 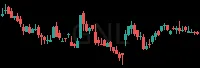 | Real Estate | 7.47 | -0.03% | -0.20 | 10.56 | -5.70 | 158% | 4.2M |
| VITL |  | Consumer Sta | 8.62 | -0.03% | -0.29 | 1.87 | -2.33 | 156% | 2.6M |
| STWD |  | Real Estate | 12.72 | +0.02% | +0.24 | 1.96 | -6.31 | 154% | 7.8M |
| ECL |  | Consumer Dis | 290.76 | +0.01% | +3.05 | -2.27 | 0.85 | 153% | 1.9M |
| BXMT | 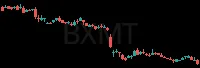 | Real Estate | 10.85 | +0.03% | +0.27 | 1.15 | -5.32 | 153% | 4.0M |
| WPC |  | Real Estate | 64.45 | +0.01% | +0.89 | 2.49 | -2.62 | 151% | 2.1M |
| WHR | 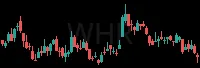 | Consumer Dis | 28.25 | +0.02% | +0.62 | 4.33 | -3.62 | 151% | 3.9M |
| BJ |  | Consumer Sta | 103.27 | 0.00% | -0.12 | 2.55 | 1.65 | 150% | 2.8M |
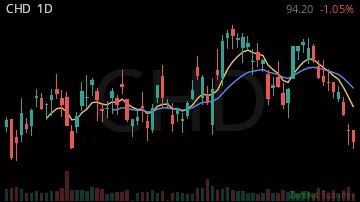
| CHD |  | Consumer Dis | 103.08 | 0.00% | +0.45 | 2.63 | 3.99 | 147% | 2.6M |
| COST |  | Consumer Sta | 978.06 | 0.00% | -3.94 | -0.56 | 3.27 | 147% | 3.0M |
| CRGY |  | Energy | 12.53 | -0.02% | -0.32 | -12.84 | -0.92 | 146% | 11.0M |
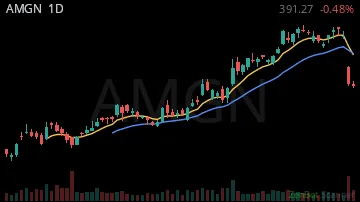
| AMGN | 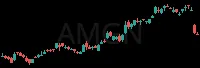 | Health Care | 434.90 | +0.02% | +8.79 | -1.81 | 0.14 | 146% | 4.6M |
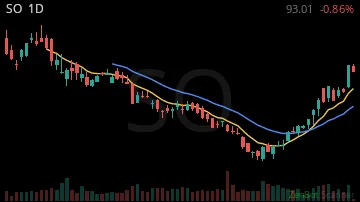
| SO |  | Utilities | 89.18 | +0.01% | +1.07 | 1.05 | 2.98 | 145% | 8.6M |
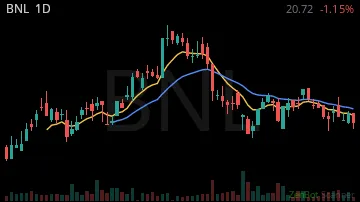
| BNL | 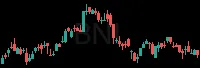 | Real Estate | 18.20 | +0.01% | +0.20 | 8.65 | -2.86 | 143% | 3.0M |
| ITUB |  | Finance | 9.50 | -0.04% | -0.39 | 1.48 | 3.34 | 143% | 40.2M |
| IVR | 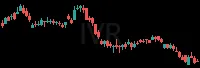 | Real Estate | 5.67 | +0.01% | +0.07 | 2.55 | -5.43 | 143% | 4.4M |
| ORI |  | Finance | 38.67 | +0.01% | +0.52 | -1.72 | -0.44 | 143% | 3.0M |
| NOMD |  | Consumer Sta | 11.45 | 0.00% | -0.02 | 1.29 | 1.44 | 142% | 2.2M |
| GILD | 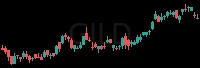 | Health Care | 157.68 | +0.07% | +9.76 | -0.44 | -2.01 | 142% | 8.3M |
| PAYX |  | Industrials | 110.50 | +0.04% | +4.25 | -4.83 | 1.27 | 142% | 4.0M |
| PHM |  | Consumer Dis | 113.08 | +0.01% | +1.50 | 2.02 | -3.89 | 141% | 2.2M |
| CIM |  | Real Estate | 8.55 | +0.01% | +0.07 | -16.81 | -6.42 | 140% | 1.7M |
| CVE | 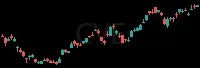 | Energy | 32.44 | -0.01% | -0.18 | 10.06 | 0.95 | 140% | 9.6M |
| AEP | 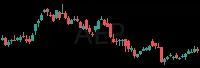 | Utilities | 123.54 | -0.02% | -2.59 | -17.42 | 3.41 | 140% | 5.1M |
| ARR |  | Real Estate | 13.64 | 0.00% | +0.02 | -2.50 | -1.54 | 139% | 5.7M |
| WRBY |  | Health Care | 24.64 | -0.01% | -0.28 | 7.60 | -0.46 | 138% | 4.1M |
| JBS |  | Consumer Sta | 12.85 | -0.01% | -0.08 | 12.75 | 2.35 | 135% | 7.6M |
| MDLZ |  | Consumer Sta | 63.03 | +0.02% | +1.53 | -1.06 | 0.01 | 135% | 10.3M |
| KR |  | Consumer Sta | 62.71 | +0.03% | +1.97 | 0.38 | 0.16 | 134% | 9.6M |
| SVC |  | Real Estate | 6.37 | +0.09% | +0.52 | 7.26 | -2.12 | 133% | 2.6M |
| BMRN |  | Health Care | 56.11 | +0.02% | +0.97 | 13.11 | -3.56 | 132% | 2.9M |
| HOG |  | Consumer Dis | 28.25 | +0.03% | +0.78 | 11.40 | 0.97 | 131% | 2.5M |
| ORC | 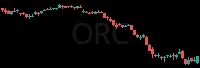 | Real Estate | 5.24 | +0.04% | +0.18 | 12.48 | -4.49 | 131% | 7.0M |
| HRL | 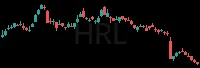 | Consumer Sta | 20.23 | +0.05% | +1.02 | 4.54 | -2.40 | 129% | 6.7M |
| TU |  | Telecommunic | 8.36 | +0.03% | +0.25 | 1.06 | -1.73 | 129% | 9.4M |
| MO |  | Consumer Sta | 73.76 | +0.03% | +2.20 | 1.82 | 0.99 | 129% | 10.9M |
| CPB |  | Consumer Sta | 19.85 | +0.04% | +0.75 | -1.17 | -2.34 | 128% | 9.8M |
| PAGP | 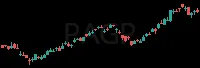 | Energy | 27.18 | 0.00% | +0.09 | 1.20 | -0.09 | 128% | 2.6M |
| BKH |  | Utilities | 75.87 | -0.01% | -0.56 | 3.49 | 2.46 | 128% | 1.4M |
| BMY |  | Health Care | 61.00 | +0.03% | +1.72 | 5.37 | -3.17 | 126% | 13.8M |
| COP | 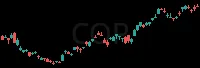 | Energy | 141.00 | -0.01% | -1.34 | -15.33 | 4.78 | 125% | 8.3M |
| HLN | 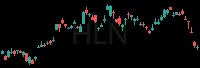 | Consumer Dis | 9.85 | +0.04% | +0.41 | -10.40 | -0.09 | 125% | 18.3M |
| OVV |  | Energy | 66.13 | -0.01% | -0.53 | 7.44 | 2.61 | 123% | 4.0M |
| WEC | 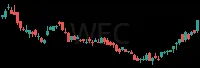 | Utilities | 105.97 | -0.01% | -0.78 | 0.53 | 2.48 | 122% | 3.2M |
| GPCR |  | Health Care | 21.75 | -0.03% | -0.56 | -13.25 | -8.91 | 122% | 1.4M |
| SFM |  | Consumer Sta | 66.00 | +0.04% | +2.40 | -1.26 | -0.61 | 121% | 2.3M |
| MNST |  | Consumer Sta | 45.26 | +0.05% | +1.95 | 6.48 | -0.90 | 121% | 11.4M |
| FLG | 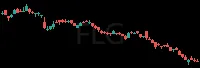 | Finance | 11.08 | -0.01% | -0.13 | -12.62 | -5.33 | 121% | 5.6M |
| CF |  | Industrials | 119.80 | 0.00% | +0.34 | 16.94 | 0.41 | 121% | 3.2M |
| EQNR |  | Energy | 44.10 | -0.03% | -1.19 | -12.58 | 2.12 | 120% | 4.1M |
| TDAY | 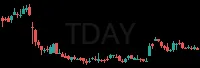 | Consumer Dis | 7.18 | 0.00% | +0.03 | -3.81 | 1.57 | 120% | 3.9M |
| VTR |  | Real Estate | 84.59 | 0.00% | +0.28 | -1.60 | -2.12 | 120% | 4.2M |
| TRI |  | Consumer Dis | 107.89 | +0.02% | +2.49 | -0.73 | 1.87 | 119% | 2.3M |
| ACI |  | Consumer Sta | 13.02 | 0.00% | -0.06 | 3.93 | 2.79 | 119% | 9.1M |
| PDM |  | Real Estate | 8.98 | -0.01% | -0.12 | 2.53 | -1.45 | 119% | 1.8M |
| MFA |  | Real Estate | 6.73 | 0.00% | +0.03 | 5.73 | -7.25 | 119% | 2.3M |
| GBDC |  | Finance | 12.40 | +0.03% | +0.31 | 8.46 | -2.75 | 119% | 1.6M |
| UGP |  | Utilities | 7.61 | -0.03% | -0.23 | 3.12 | 1.89 | 119% | 4.7M |
| TIGO |  | Telecommunic | 82.07 | +0.02% | +1.73 | 4.67 | -3.14 | 119% | 1.5M |
RS = relative strength vs SPY, in ATRs (1 hour / 2 weeks); green leads the market, red lags. RVOL = today's volume vs average. Prices are 15-minute delayed.
New here? How to trade these scans · More Movers scans: Price Pops - Short · Big Move Down - Short · Falling Strength · Unusual Volume - Short · Most Volume · Weakest