All scans · Short
Top Losers Scanner
Open live →ZenBot is a free real-time scanner that surfaces the stocks in play — heavy volume, leading their sector, moving before the crowd. This is one of its built-in scans.
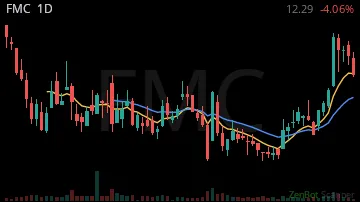
FMC5.70 -0.31%
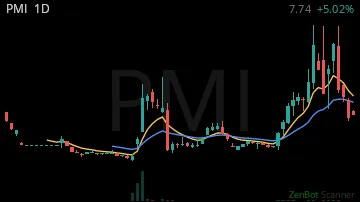
PMI11.22 -0.27%
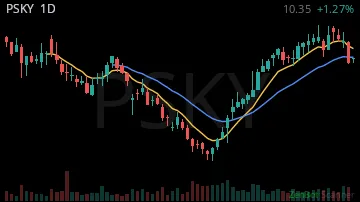
PSKY7.26 -0.26%
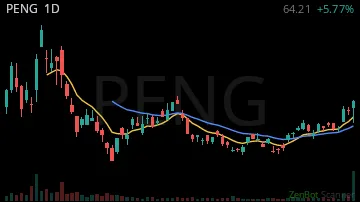
PENG62.29 -0.20%
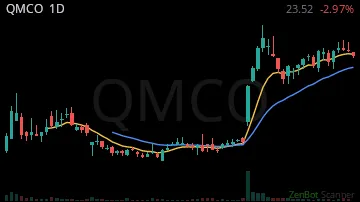
QMCO21.58 -0.19%
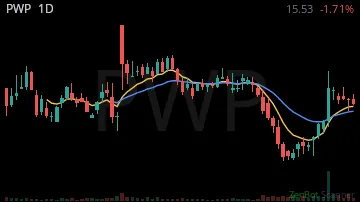
PWP13.23 -0.18%
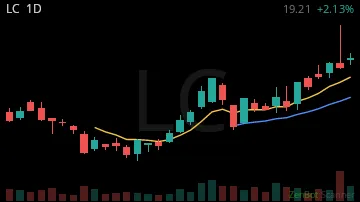
LC16.22 -0.16%
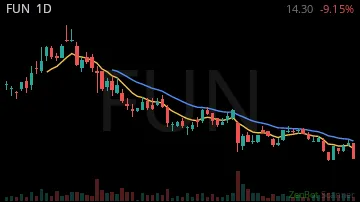
FUN8.65 -0.15%
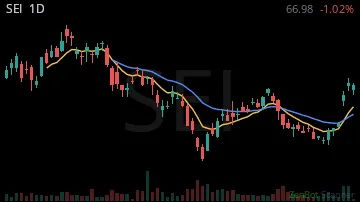
SEI65.99 -0.15%
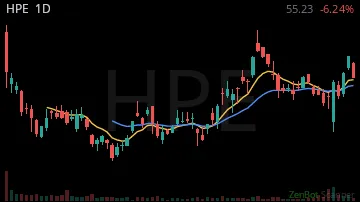
HPE58.52 -0.15%
P134.00 -0.15%

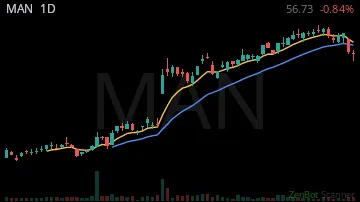
MAN44.10 -0.15%
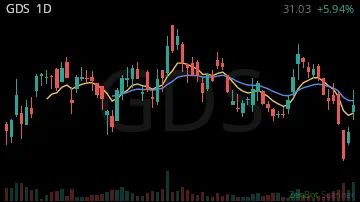
GDS25.32 -0.14%
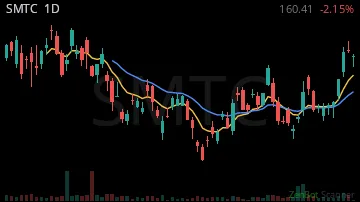
SMTC148.50 -0.14%
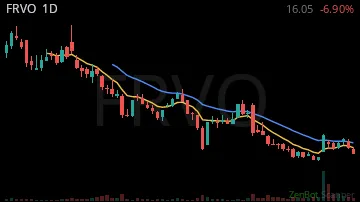
FRVO10.32 -0.14%
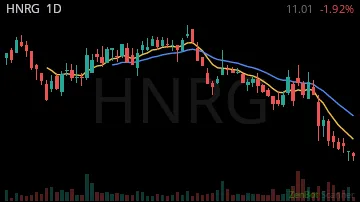
HNRG12.06 -0.14%
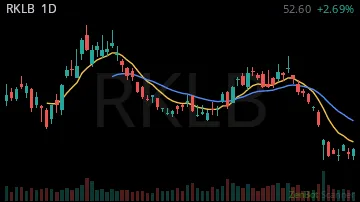
RKLB55.65 -0.13%
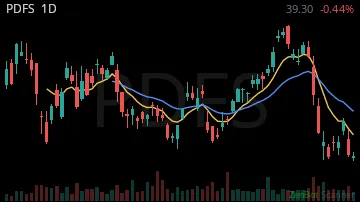
PDFS41.27 -0.13%
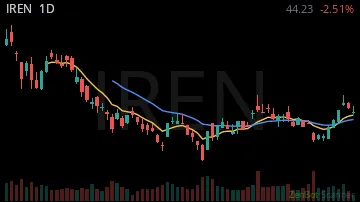
IREN30.42 -0.13%
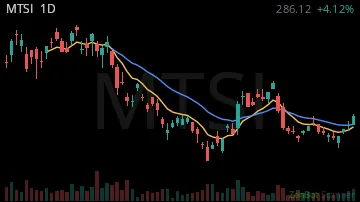
MTSI271.00 -0.12%
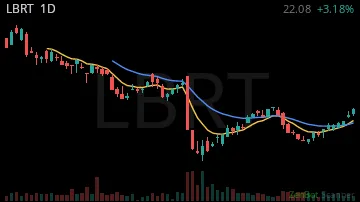
LBRT16.84 -0.12%
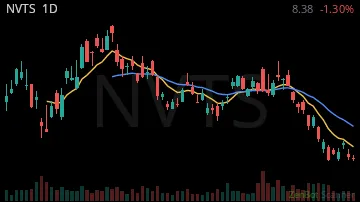
NVTS9.23 -0.12%
SIMO218.50 -0.11%

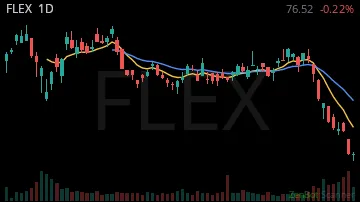
FLEX98.30 -0.11%
MOD153.00 -0.11%

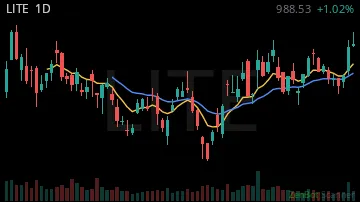
LITE876.92 -0.11%
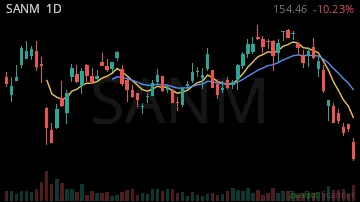
SANM188.04 -0.11%
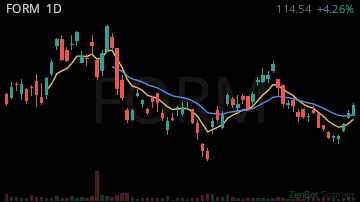
FORM113.74 -0.11%
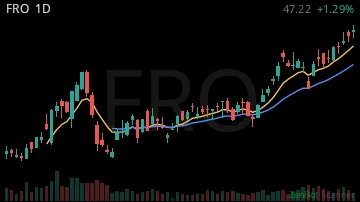
FRO52.59 -0.11%
MXL79.00 -0.11%

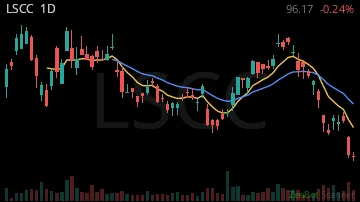
LSCC108.00 -0.11%
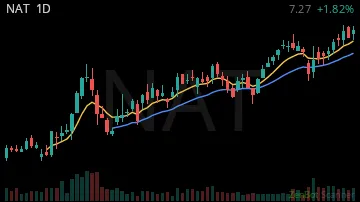
NAT7.85 -0.11%
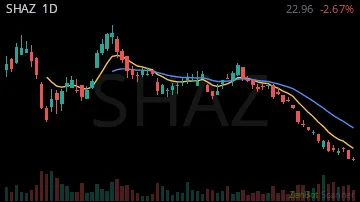
SHAZ30.98 -0.11%
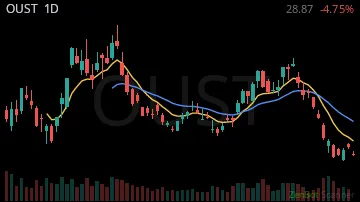
OUST31.54 -0.11%
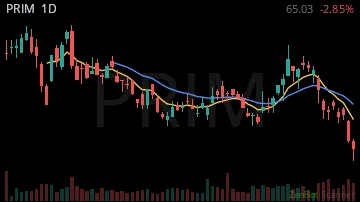
PRIM73.75 -0.11%
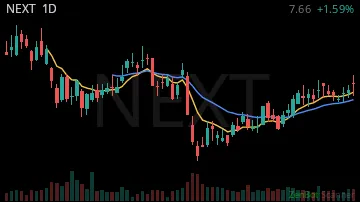
NEXT6.09 -0.10%
MRVL240.64 -0.10%
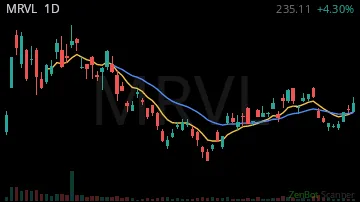
STRL447.13 -0.10%
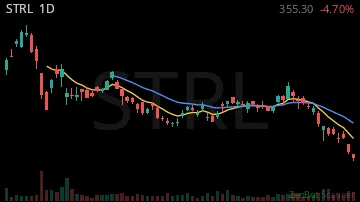
ONTO236.71 -0.10%
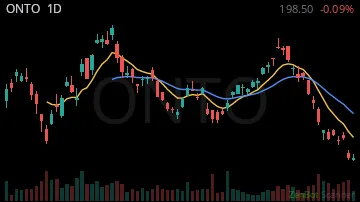
SMCI35.11 -0.10%
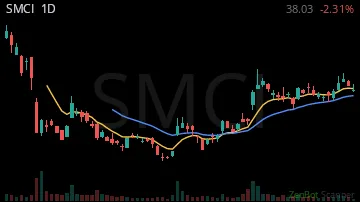
NTAP214.80 -0.10%

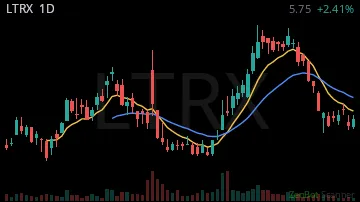
LTRX5.74 -0.10%
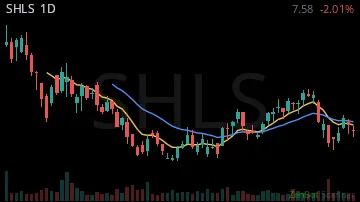
SHLS7.79 -0.10%
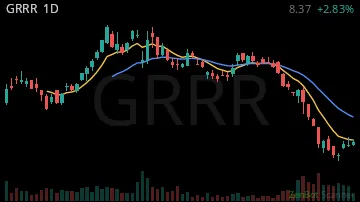
GRRR8.52 -0.10%
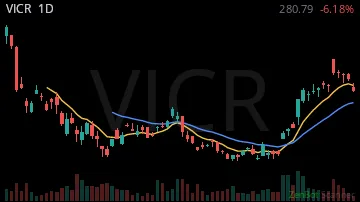
VICR221.00 -0.10%
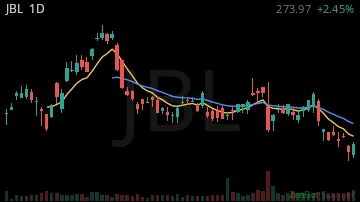
JBL287.00 -0.10%
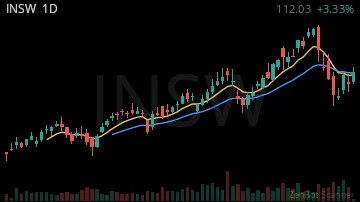
INSW113.11 -0.10%
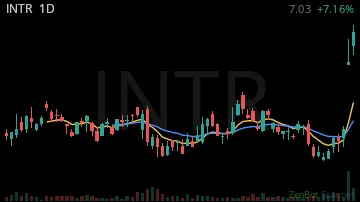
INTR6.74 -0.10%
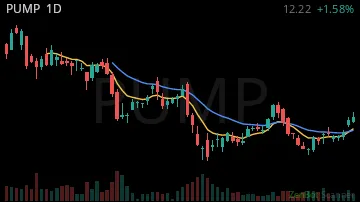
PUMP8.00 -0.09%
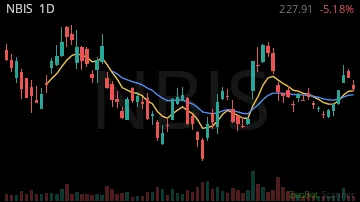
NBIS187.90 -0.09%
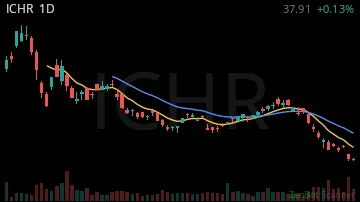
ICHR46.85 -0.09%
KGS47.25 -0.09%

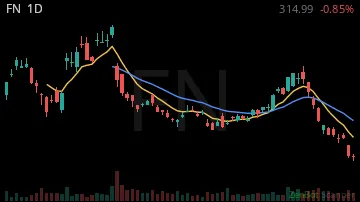
FN388.83 -0.09%
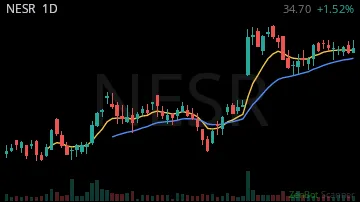
NESR19.13 -0.09%
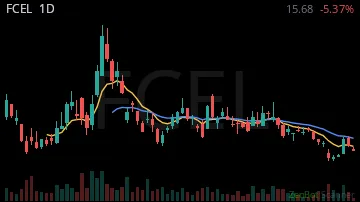
FCEL14.10 -0.09%
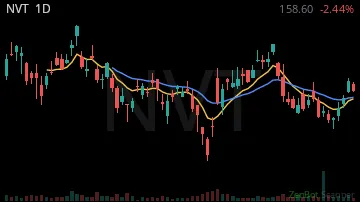
NVT147.00 -0.09%
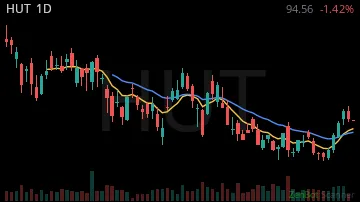
HUT76.12 -0.09%
GOSS8.89 -0.09%

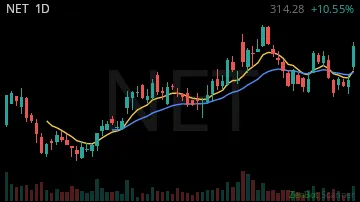
NET317.00 -0.09%
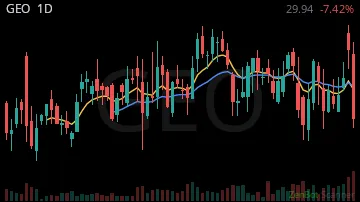
GEO29.40 -0.09%
FTK24.73 -0.09%

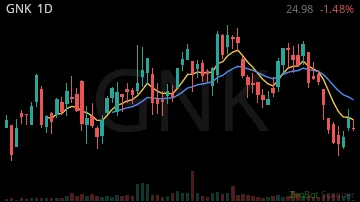
GNK24.30 -0.08%
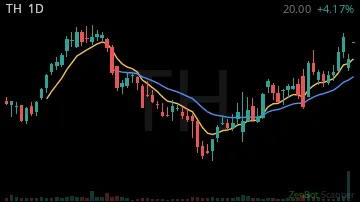
TH15.80 -0.08%
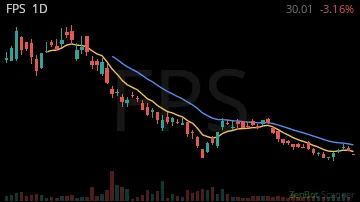
FPS33.15 -0.08%
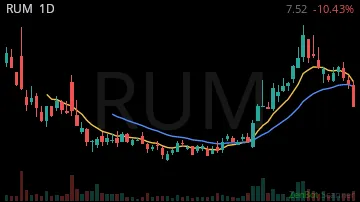
RUM6.15 -0.08%
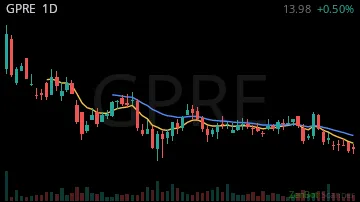
GPRE14.29 -0.08%
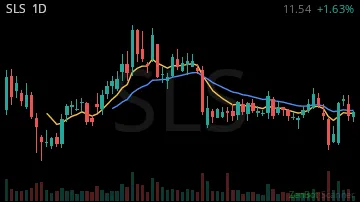
SLS11.40 -0.08%
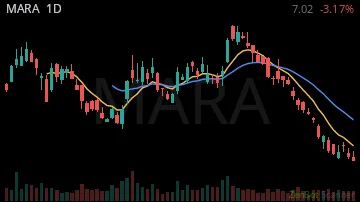
MARA8.37 -0.08%
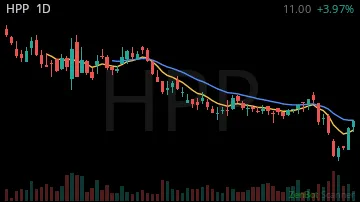
HPP11.17 -0.08%
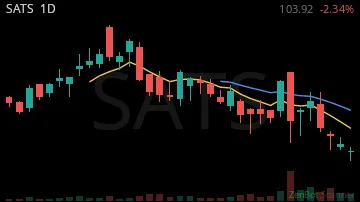
SATS95.71 -0.08%
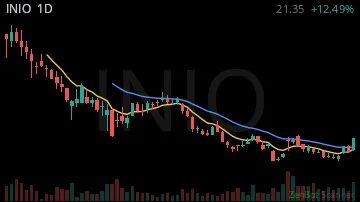
INIO16.87 -0.08%
FSLY24.97 -0.08%

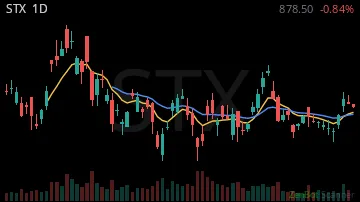
STX688.80 -0.08%
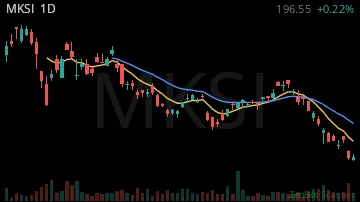
MKSI228.52 -0.08%
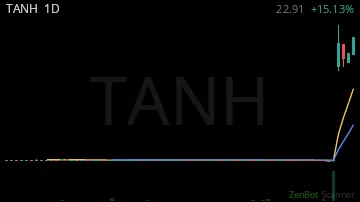
TANH12.84 -0.08%
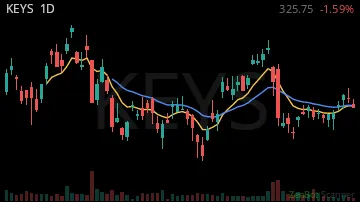
KEYS342.08 -0.08%
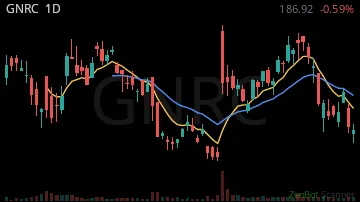
GNRC198.02 -0.08%
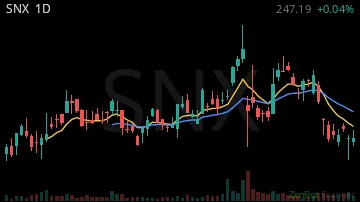
SNX255.14 -0.08%
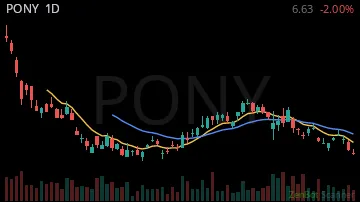
PONY5.17 -0.08%
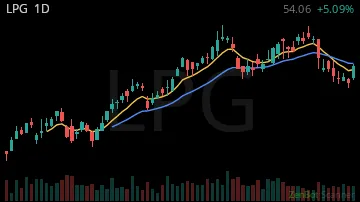
LPG53.68 -0.07%
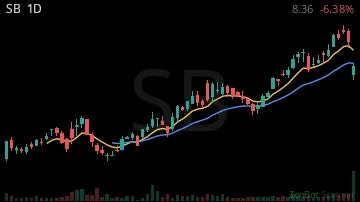
SB8.02 -0.07%
LRCX278.95 -0.07%
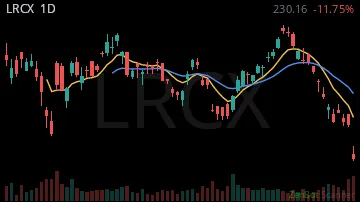
GLXY18.26 -0.07%

LASR35.75 -0.07%
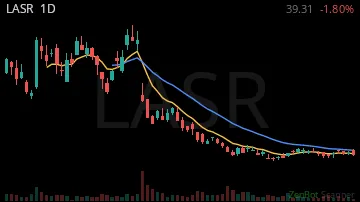
HSAI13.40 -0.07%
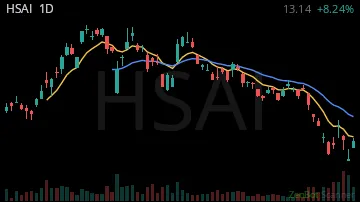
OKTA210.02 -0.07%

GEV930.93 -0.07%
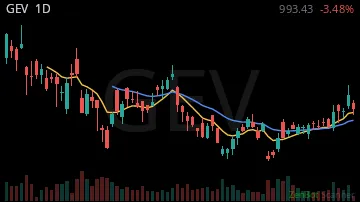
NXTT5.20 -0.07%

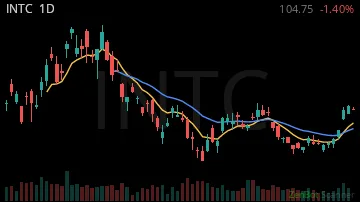
INTC95.41 -0.07%
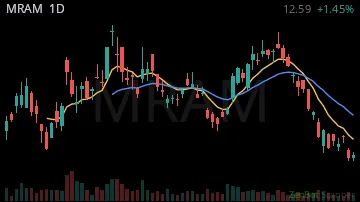
MRAM14.00 -0.07%
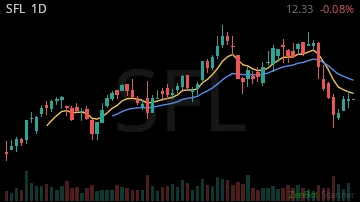
SFL12.61 -0.07%
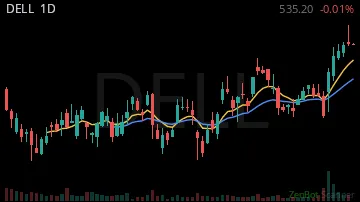
DELL472.00 -0.07%
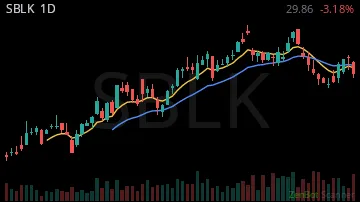
SBLK27.69 -0.07%
NMAX9.34 -0.07%

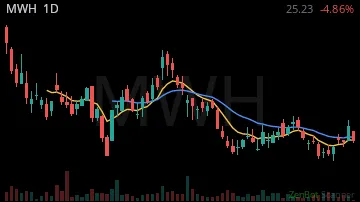
MWH23.94 -0.07%
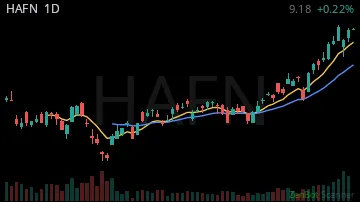
HAFN10.10 -0.07%
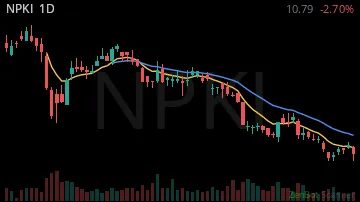
NPKI10.51 -0.07%
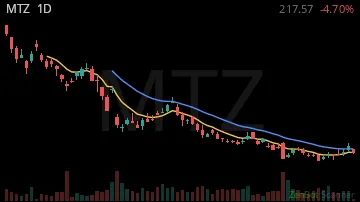
MTZ192.00 -0.07%
GLW138.53 -0.07%

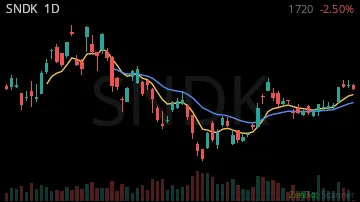
SNDK1383.00 -0.07%
| Symbol | Chart | Sector | Last | Chg % | Chg $ | RS 1H | RS 2W | RVOL | Vol |
|---|---|---|---|---|---|---|---|---|---|
| FMC |  | Industrials | 5.70 | -0.31% | -2.61 | 3.83 | -4.02 | 889% | 32.6M |
| PMI |  | Health Care | 11.22 | -0.27% | -4.11 | -1.68 | 4.74 | 76% | 1.5M |
| PSKY | 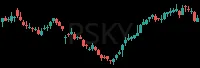 | Industrials | 7.26 | -0.26% | -2.52 | -3.72 | -3.14 | 812% | 148.3M |
| PENG | 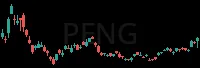 | Technology | 62.29 | -0.20% | -15.91 | -2.79 | 3.06 | 266% | 6.9M |
| QMCO | 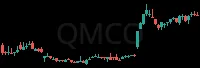 | Technology | 21.58 | -0.19% | -4.94 | -1.61 | -2.83 | 166% | 3.3M |
| PWP | 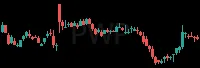 | Finance | 13.23 | -0.18% | -2.87 | -6.40 | 0.73 | 199% | 3.3M |
| LC | 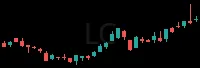 | Finance | 16.22 | -0.16% | -2.99 | -3.81 | 2.98 | 100% | 0 |
| FUN | 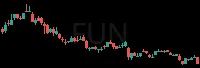 | Consumer Dis | 8.65 | -0.15% | -1.55 | -1.51 | -3.76 | 337% | 9.6M |
| SEI | 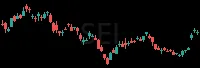 | Consumer Dis | 65.99 | -0.15% | -11.84 | 10.54 | 0.56 | 203% | 5.4M |
| HPE | 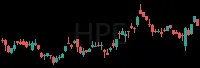 | Technology | 58.52 | -0.15% | -10.29 | 0.59 | 0.53 | 162% | 34.8M |
| P |  | Technology | 134.00 | -0.15% | -22.97 | 3.67 | 4.04 | 117% | 6.3M |
| MAN | 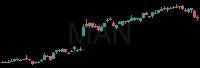 | Consumer Dis | 44.10 | -0.15% | -7.54 | 2.02 | -3.64 | 442% | 3.8M |
| GDS | 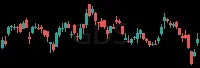 | Technology | 25.32 | -0.14% | -4.28 | 3.30 | -3.03 | 257% | 4.5M |
| SMTC | 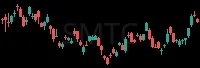 | Technology | 148.50 | -0.14% | -24.28 | -1.41 | -1.90 | 299% | 9.7M |
| FRVO |  | Utilities | 10.32 | -0.14% | -1.66 | 2.15 | -3.96 | 295% | 20.1M |
| HNRG | 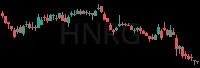 | Utilities | 12.06 | -0.14% | -1.89 | -1.47 | -1.97 | 110% | 971.1K |
| RKLB | 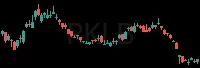 | Industrials | 55.65 | -0.13% | -8.57 | -1.98 | -3.76 | 254% | 49.5M |
| PDFS | 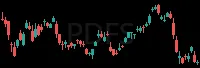 | Technology | 41.27 | -0.13% | -6.35 | -2.41 | -1.84 | 158% | 945.5K |
| IREN | 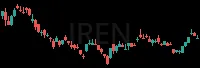 | Finance | 30.42 | -0.13% | -4.38 | -1.52 | -5.12 | 257% | 107.5M |
| MTSI | 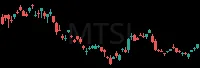 | Technology | 271.00 | -0.12% | -37.75 | -12.32 | 0.21 | 181% | 2.5M |
| LBRT |  | Energy | 16.84 | -0.12% | -2.27 | -2.66 | -0.93 | 184% | 6.7M |
| NVTS | 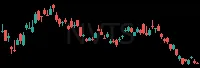 | Technology | 9.23 | -0.12% | -1.22 | -1.19 | -3.23 | 167% | 23.5M |
| SIMO |  | Technology | 218.50 | -0.11% | -28.13 | -11.26 | -3.38 | 143% | 1.3M |
| FLEX | 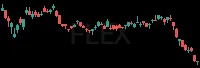 | Technology | 98.30 | -0.11% | -12.58 | -4.54 | -1.78 | 278% | 8.6M |
| MOD |  | Consumer Dis | 153.00 | -0.11% | -19.57 | -2.23 | -3.46 | 193% | 2.5M |
| LITE | 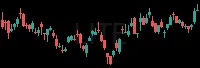 | Telecommunic | 876.92 | -0.11% | -111.07 | -0.16 | -0.47 | 161% | 7.6M |
| SANM | 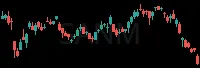 | Technology | 188.04 | -0.11% | -23.75 | -3.77 | -2.37 | 193% | 1.2M |
| FORM | 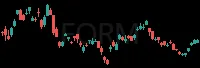 | Technology | 113.74 | -0.11% | -14.35 | 2.95 | -1.33 | 129% | 1.9M |
| FRO |  | Consumer Dis | 52.59 | -0.11% | -6.45 | 1.31 | 4.59 | 189% | 6.3M |
| MXL | 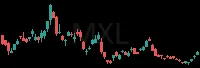 | Technology | 79.00 | -0.11% | -9.64 | 0.73 | -1.74 | 192% | 5.1M |
| LSCC | 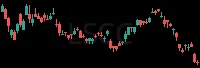 | Technology | 108.00 | -0.11% | -13.15 | 0.09 | -2.46 | 185% | 3.1M |
| NAT | 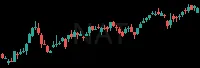 | Consumer Dis | 7.85 | -0.11% | -0.94 | 0.97 | 2.06 | 165% | 7.4M |
| SHAZ | 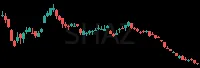 | Technology | 30.98 | -0.11% | -3.73 | -2.01 | -6.64 | 252% | 4.2M |
| OUST | 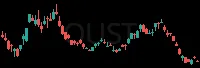 | Industrials | 31.54 | -0.11% | -3.79 | -1.99 | -4.18 | 201% | 4.9M |
| PRIM |  | Industrials | 73.75 | -0.11% | -8.77 | 0.78 | 1.23 | 131% | 2.2M |
| NEXT | 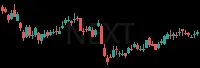 | Utilities | 6.09 | -0.10% | -0.71 | 4.12 | -0.33 | 149% | 3.7M |
| MRVL | 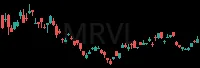 | Technology | 240.64 | -0.10% | -28.08 | -0.70 | -0.67 | 111% | 24.0M |
| STRL | 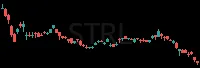 | Industrials | 447.13 | -0.10% | -51.48 | 0.74 | -1.59 | 237% | 1.3M |
| ONTO | 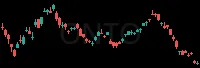 | Industrials | 236.71 | -0.10% | -26.84 | 0.86 | -2.70 | 156% | 1.5M |
| SMCI | 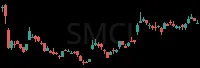 | Technology | 35.11 | -0.10% | -3.96 | -1.41 | -2.99 | 88% | 37.7M |
| NTAP |  | Technology | 214.80 | -0.10% | -24.21 | 3.08 | 3.48 | 110% | 2.9M |
| LTRX | 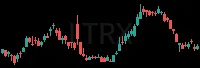 | Telecommunic | 5.74 | -0.10% | -0.64 | -18.21 | -2.99 | 68% | 729.9K |
| SHLS | 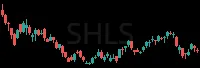 | Technology | 7.79 | -0.10% | -0.86 | 10.15 | 1.98 | 102% | 4.6M |
| GRRR | 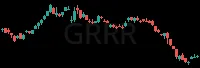 | Technology | 8.52 | -0.10% | -0.94 | 3.03 | -6.67 | 161% | 1.5M |
| VICR | 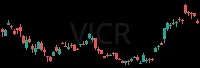 | Technology | 221.00 | -0.10% | -24.35 | 8.65 | -2.59 | 215% | 1.8M |
| JBL | 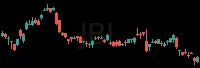 | Technology | 287.00 | -0.10% | -30.86 | 2.00 | -1.04 | 139% | 1.7M |
| INSW | 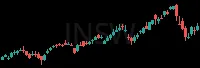 | Consumer Dis | 113.11 | -0.10% | -11.93 | -1.89 | 3.30 | 82% | 808.2K |
| INTR | 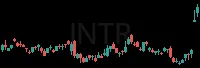 | Finance | 6.74 | -0.10% | -0.71 | 7.79 | 4.83 | 112% | 7.6M |
| PUMP | 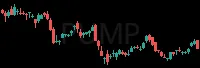 | Energy | 8.00 | -0.09% | -0.81 | 6.23 | -2.82 | 169% | 5.8M |
| NBIS | 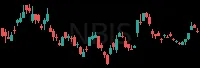 | Technology | 187.90 | -0.09% | -18.96 | -2.26 | -3.18 | 251% | 47.9M |
| ICHR | 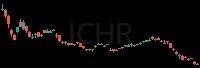 | Technology | 46.85 | -0.09% | -4.72 | -0.61 | -3.03 | 160% | 1.2M |
| KGS | 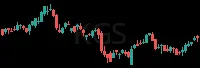 | Utilities | 47.25 | -0.09% | -4.75 | -5.56 | -1.53 | 118% | 2.2M |
| FN | 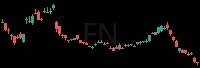 | Utilities | 388.83 | -0.09% | -38.99 | 1.14 | -0.73 | 111% | 1.0M |
| NESR | 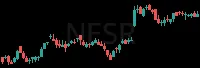 | Energy | 19.13 | -0.09% | -1.90 | -12.27 | -7.85 | 161% | 3.8M |
| FCEL | 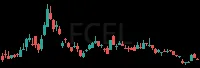 | Energy | 14.10 | -0.09% | -1.40 | -0.24 | -1.73 | 94% | 6.9M |
| NVT | 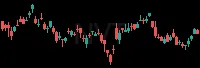 | Industrials | 147.00 | -0.09% | -14.47 | 3.83 | -1.55 | 236% | 5.0M |
| HUT | 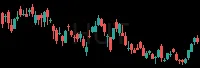 | Finance | 76.12 | -0.09% | -7.49 | -0.15 | -3.18 | 330% | 16.8M |
| GOSS |  | Health Care | 8.89 | -0.09% | -0.87 | -2.85 | -2.41 | 17% | 197.8K |
| NET | 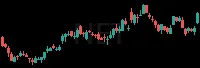 | Technology | 317.00 | -0.09% | -30.70 | -7.51 | -1.20 | 134% | 4.5M |
| GEO | 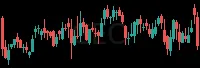 | Consumer Dis | 29.40 | -0.09% | -2.79 | 0.43 | -0.44 | 63% | 1.8M |
| FTK | 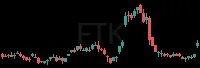 | Industrials | 24.73 | -0.09% | -2.34 | -1.06 | -2.43 | 39% | 351.9K |
| GNK | 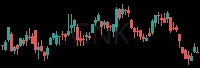 | Consumer Dis | 24.30 | -0.08% | -2.25 | -5.59 | -0.55 | 91% | 611.1K |
| TH | 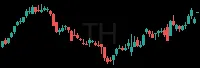 | Consumer Dis | 15.80 | -0.08% | -1.46 | -17.02 | -2.81 | 224% | 4.5M |
| FPS | 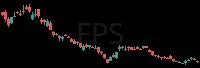 | Energy | 33.15 | -0.08% | -3.03 | 1.58 | -2.34 | 105% | 8.2M |
| RUM | 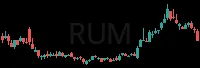 | Technology | 6.15 | -0.08% | -0.56 | 12.85 | -4.71 | 107% | 5.4M |
| GPRE | 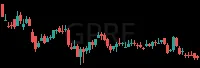 | Industrials | 14.29 | -0.08% | -1.29 | -0.93 | 0.10 | 78% | 1.7M |
| SLS | 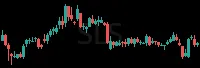 | Health Care | 11.40 | -0.08% | -1.01 | 10.56 | 0.07 | 74% | 4.7M |
| MARA | 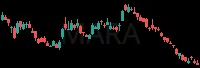 | Finance | 8.37 | -0.08% | -0.74 | 0.48 | -6.28 | 93% | 41.6M |
| HPP | 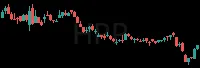 | Finance | 11.17 | -0.08% | -0.98 | -1.15 | -0.04 | 79% | 785.6K |
| SATS | 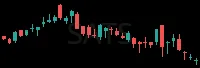 | Consumer Dis | 95.71 | -0.08% | -8.21 | -0.04 | -0.11 | 100% | 0 |
| INIO | 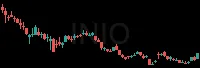 | Consumer Dis | 16.87 | -0.08% | -1.44 | 4.72 | -1.74 | 175% | 8.1M |
| FSLY | 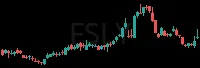 | Technology | 24.97 | -0.08% | -2.12 | -4.96 | -0.05 | 113% | 7.8M |
| STX |  | Technology | 688.80 | -0.08% | -58.40 | -0.84 | -4.35 | 138% | 5.9M |
| MKSI | 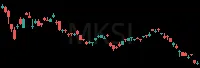 | Industrials | 228.52 | -0.08% | -19.04 | 0.99 | -2.32 | 162% | 2.6M |
| TANH |  | Industrials | 12.84 | -0.08% | -1.06 | -2.84 | -2.24 | 30% | 34.9K |
| KEYS |  | Industrials | 342.08 | -0.08% | -28.14 | 2.33 | -0.31 | 112% | 1.8M |
| GNRC | 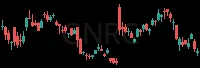 | Consumer Dis | 198.02 | -0.08% | -16.28 | -0.96 | -0.42 | 118% | 1.4M |
| SNX | 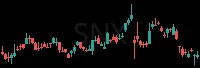 | Technology | 255.14 | -0.08% | -20.90 | 3.80 | 0.25 | 75% | 998.0K |
| PONY | 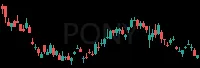 | Technology | 5.17 | -0.08% | -0.42 | 11.73 | -5.26 | 123% | 4.9M |
| LPG | 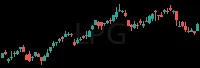 | Consumer Dis | 53.68 | -0.07% | -4.30 | 0.26 | 0.99 | 63% | 574.2K |
| SB | 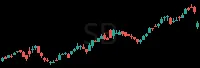 | Consumer Dis | 8.02 | -0.07% | -0.64 | 2.12 | 0.64 | 103% | 1.3M |
| LRCX |  | Technology | 278.95 | -0.07% | -22.16 | 1.70 | -2.24 | 162% | 13.4M |
| GLXY | 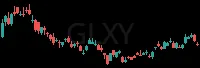 | Finance | 18.26 | -0.07% | -1.45 | -0.71 | -4.60 | 212% | 13.1M |
| LASR | 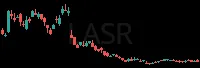 | Technology | 35.75 | -0.07% | -2.83 | 13.18 | -2.17 | 132% | 1.6M |
| HSAI | 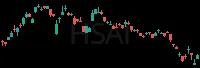 | Industrials | 13.40 | -0.07% | -1.06 | -5.21 | -4.04 | 155% | 2.1M |
| OKTA | 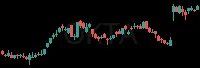 | Technology | 210.02 | -0.07% | -16.51 | 4.02 | 2.31 | 98% | 3.6M |
| GEV | 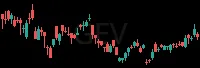 | Technology | 930.93 | -0.07% | -73.11 | 0.85 | 0.15 | 180% | 3.8M |
| NXTT |  | Technology | 5.20 | -0.07% | -0.41 | -8.07 | -1.25 | 27% | 43.6K |
| INTC | 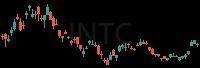 | Technology | 95.41 | -0.07% | -7.40 | -0.49 | -4.92 | 150% | 152.2M |
| MRAM |  | Technology | 14.00 | -0.07% | -1.08 | -10.70 | -4.63 | 93% | 947.0K |
| SFL | 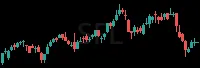 | Consumer Dis | 12.61 | -0.07% | -0.97 | 3.04 | 0.98 | 98% | 1.3M |
| DELL | 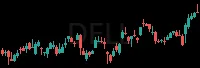 | Technology | 472.00 | -0.07% | -35.93 | -2.54 | -1.93 | 209% | 16.4M |
| SBLK | 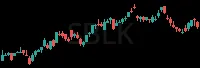 | Consumer Dis | 27.69 | -0.07% | -2.11 | 0.87 | -0.81 | 111% | 1.9M |
| NMAX |  | Industrials | 9.34 | -0.07% | -0.71 | 7.06 | -2.84 | 75% | 861.4K |
| MWH | 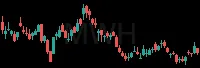 | Industrials | 23.94 | -0.07% | -1.79 | -2.73 | -0.68 | 69% | 2.0M |
| HAFN | 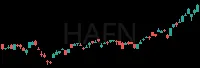 | Consumer Dis | 10.10 | -0.07% | -0.75 | 0.05 | 3.86 | 194% | 4.6M |
| NPKI | 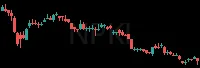 | Industrials | 10.51 | -0.07% | -0.78 | -13.91 | -2.33 | 107% | 809.6K |
| MTZ | 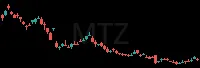 | Industrials | 192.00 | -0.07% | -14.12 | 8.70 | -1.77 | 114% | 1.7M |
| GLW |  | Industrials | 138.53 | -0.07% | -10.01 | -1.40 | -2.11 | 133% | 11.3M |
| SNDK |  | Technology | 1383.00 | -0.07% | -99.33 | -1.49 | -4.70 | 122% | 13.4M |
RS = relative strength vs SPY, in ATRs (1 hour / 2 weeks); green leads the market, red lags. RVOL = today's volume vs average. Prices are 15-minute delayed.
New here? How to trade these scans · More Movers scans: Price Pops - Short · Falling Strength · Unusual Volume - Short · Volume Building - Short · Most Volume · Weakest