All scans · Short
Unusual Volume - Short
Open live →ZenBot is a free real-time scanner that surfaces the stocks in play — heavy volume, leading their sector, moving before the crowd. This is one of its built-in scans.
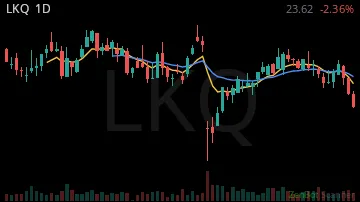
LKQ17.41 -0.23%
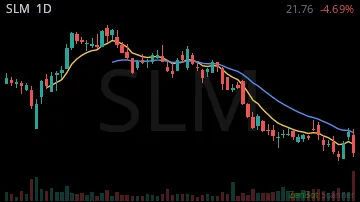
SLM19.42 -0.11%
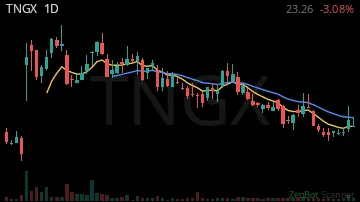
TNGX23.33 -0.16%
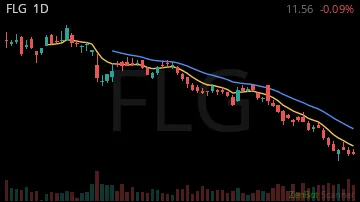
FLG10.37 -0.09%
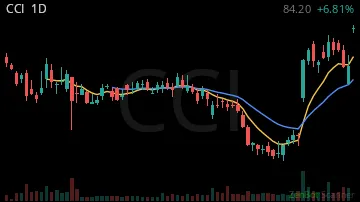
CCI85.99 +0.09%
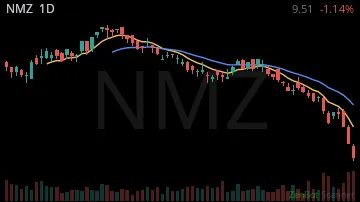
NMZ8.64 -0.05%
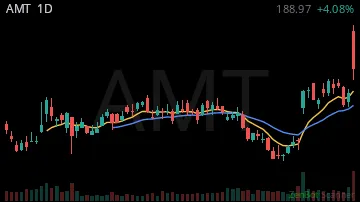
AMT188.97 +0.04%
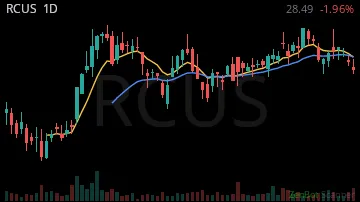
RCUS18.52 -0.04%
RNG83.39 +0.05%
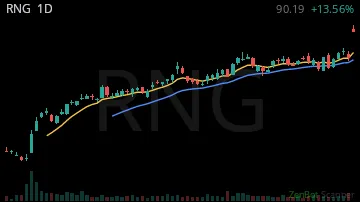
IEP5.77 -0.06%
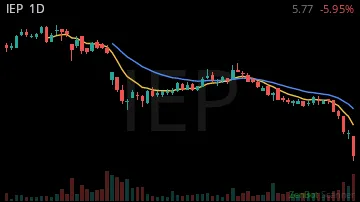
CORT85.84 -0.20%
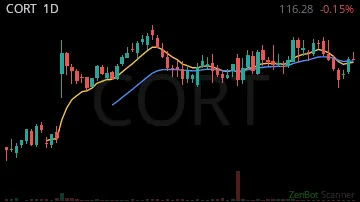
FR54.46 -0.02%
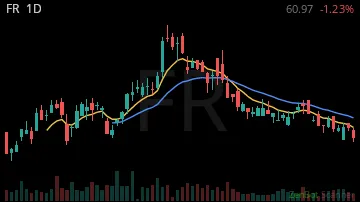
INFY12.31 -0.07%

MBLY6.54 -0.06%
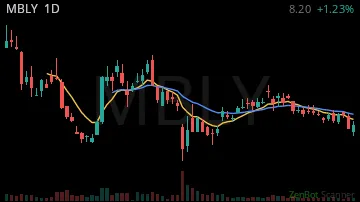
MXL63.47 -0.03%

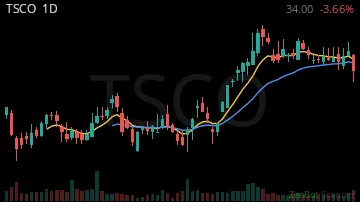
TSCO33.41 -0.04%
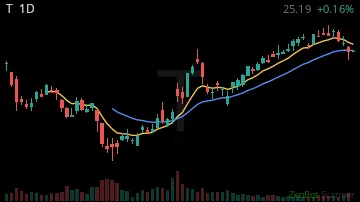
T20.93 -0.08%
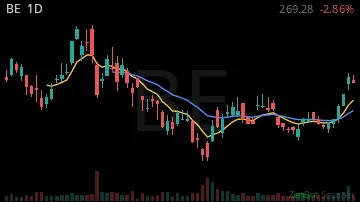
BE193.12 -0.11%
CBRE123.30 -0.06%
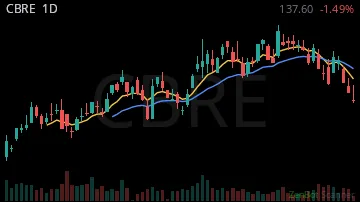
NUV8.26 -0.02%
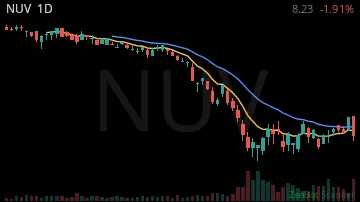
NVS151.09 -0.03%
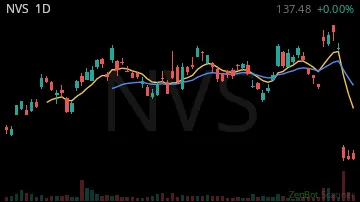
ORI38.91 -0.03%

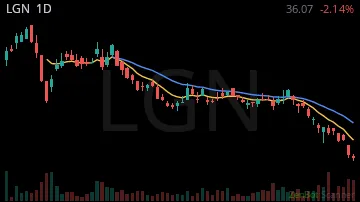
LGN36.07 -0.02%
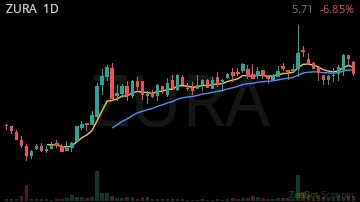
ZURA3.36 -0.05%
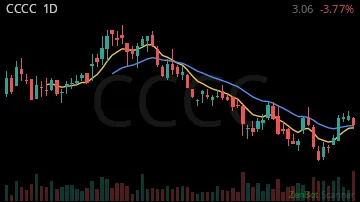
CCCC3.06 -0.04%
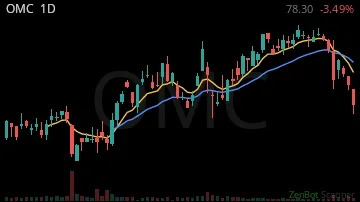
OMC82.66 0.00%
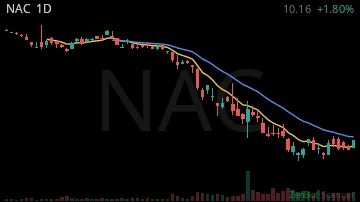
NAC9.90 -0.03%
IVZ28.06 -0.03%

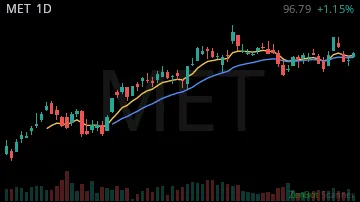
MET98.82 -0.05%
GFL45.53 +0.03%

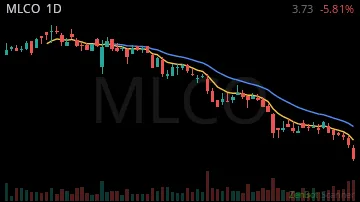
MLCO3.75 -0.05%
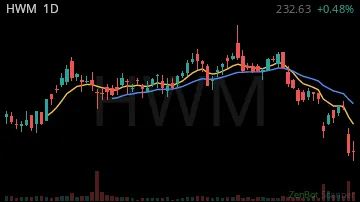
HWM185.54 -0.04%
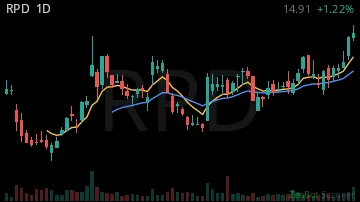
RPD14.90 +0.01%
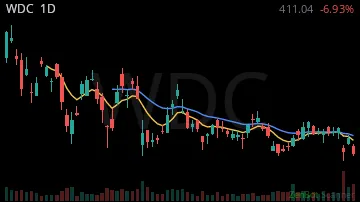
WDC343.54 -0.03%
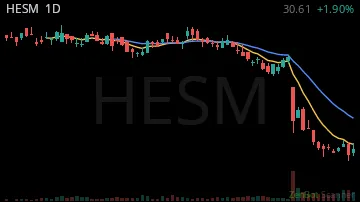
HESM30.61 +0.02%
NZF10.94 -0.01%

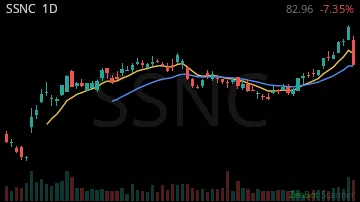
SSNC82.95 -0.07%
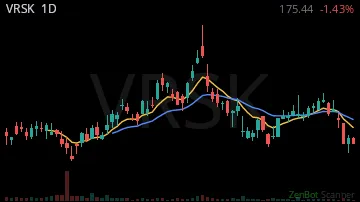
VRSK195.81 -0.04%
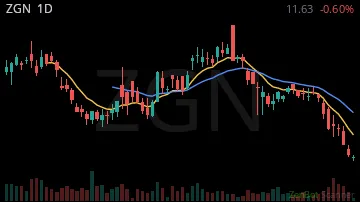
ZGN13.49 -0.03%
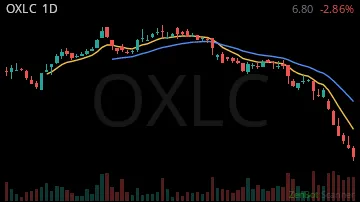
OXLC6.78 -0.03%
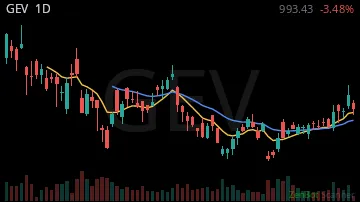
GEV814.70 -0.02%
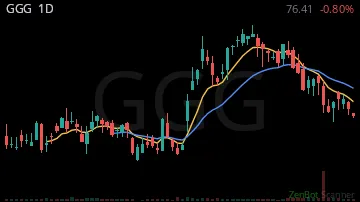
GGG66.98 -0.03%
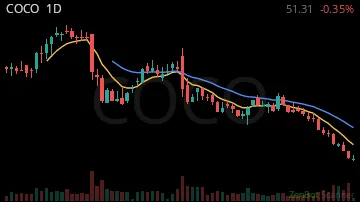
COCO56.45 -0.04%
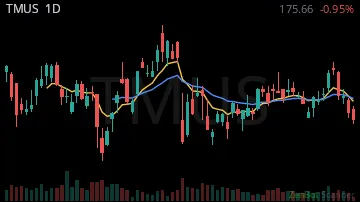
TMUS146.61 -0.08%
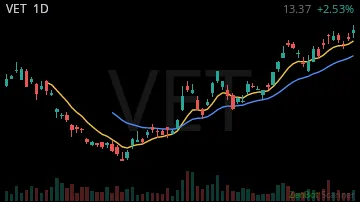
VET13.92 +0.03%
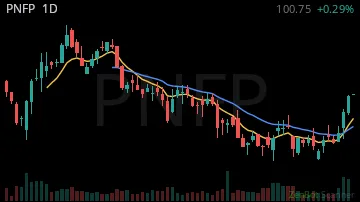
PNFP100.41 0.00%
BLMN9.20 -0.10%

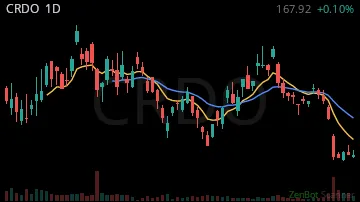
CRDO147.27 -0.10%
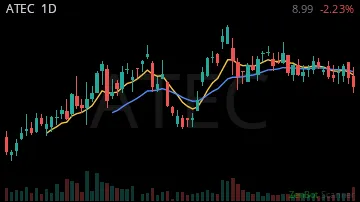
ATEC11.11 -0.02%
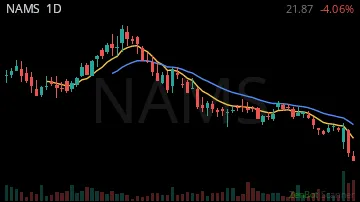
NAMS19.72 -0.09%
UNIT5.06 -0.03%

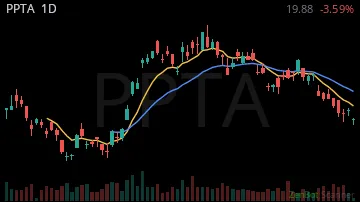
PPTA16.43 -0.05%
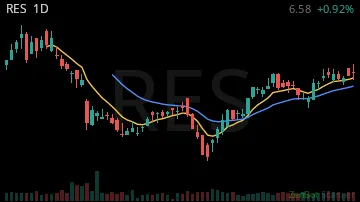
RES6.25 +0.04%
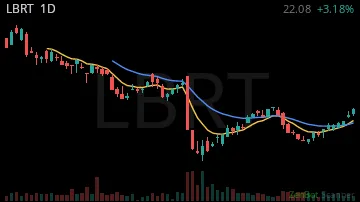
LBRT15.58 +0.01%
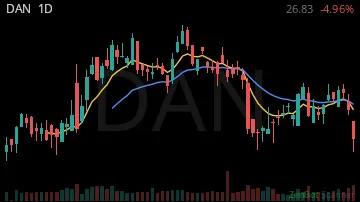
DAN26.80 -0.05%
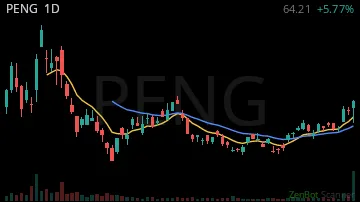
PENG53.38 +0.03%
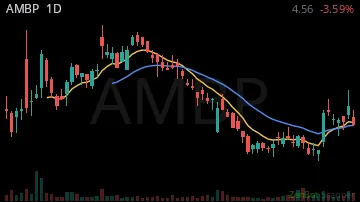
AMBP4.55 -0.04%
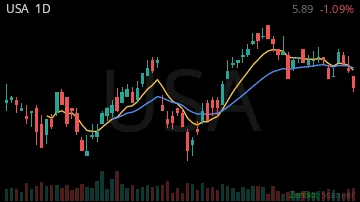
USA5.93 0.00%
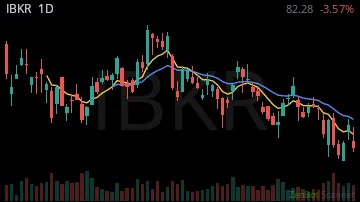
IBKR80.27 -0.02%
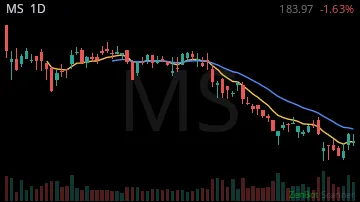
MS179.86 -0.02%
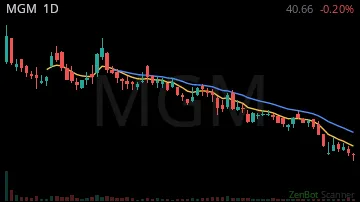
MGM28.04 -0.05%
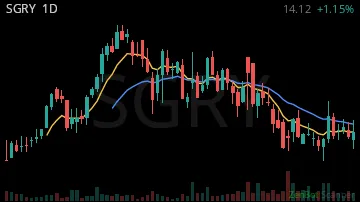
SGRY15.76 -0.01%
INSM93.46 -0.02%

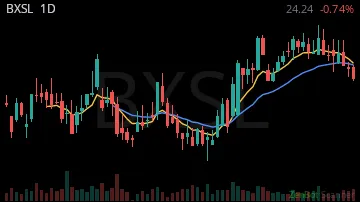
BXSL23.34 -0.02%
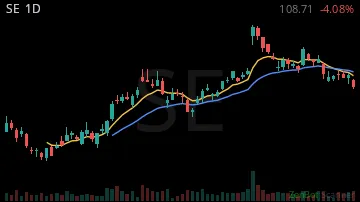
SE74.64 -0.01%
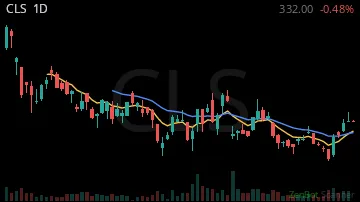
CLS260.00 -0.03%
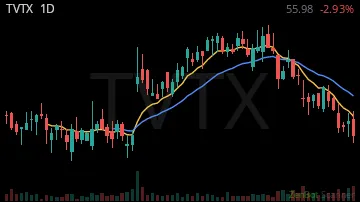
TVTX50.05 -0.05%
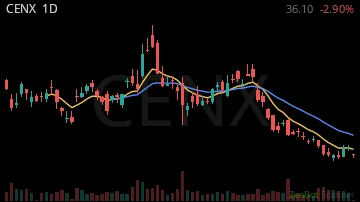
CENX31.42 -0.04%
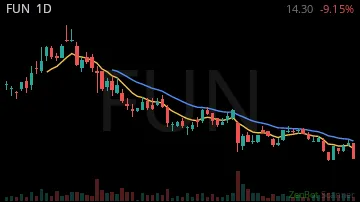
FUN6.77 -0.07%
PENN14.50 -0.06%

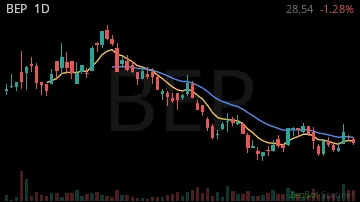
BEP28.48 -0.01%
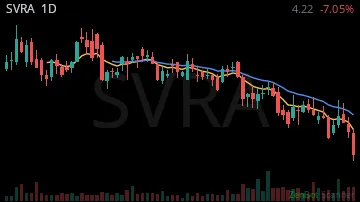
SVRA4.22 -0.07%
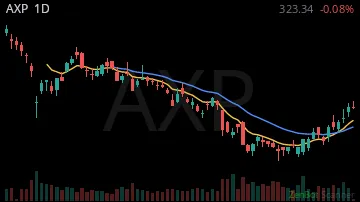
AXP313.23 -0.04%
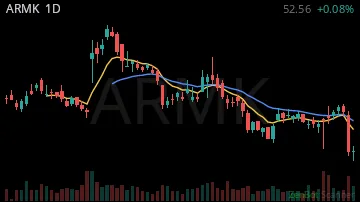
ARMK52.56 0.00%
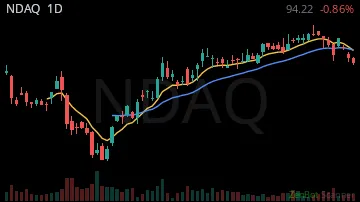
NDAQ102.61 -0.01%
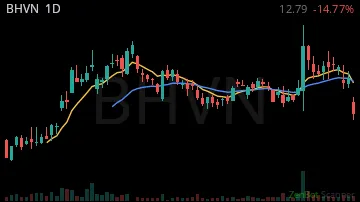
BHVN13.87 -0.06%
RMBS85.61 0.00%

HSY169.64 -0.03%

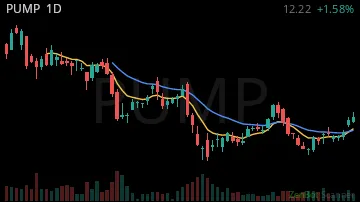
PUMP7.29 +0.01%
AVT88.03 -0.01%

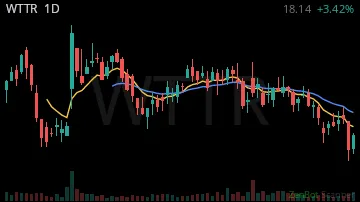
WTTR18.15 +0.03%
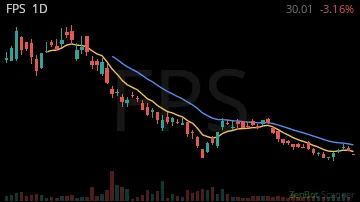
FPS24.22 -0.03%
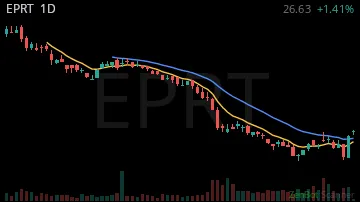
EPRT26.64 +0.01%
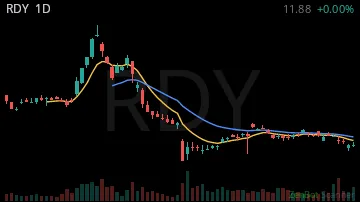
RDY13.19 0.00%
GRNT5.86 +0.04%

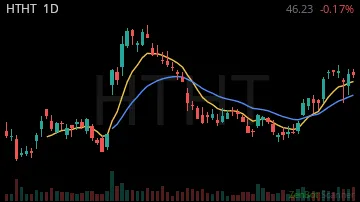
HTHT46.22 0.00%
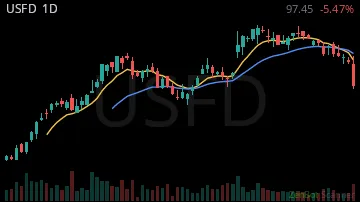
USFD100.95 -0.03%
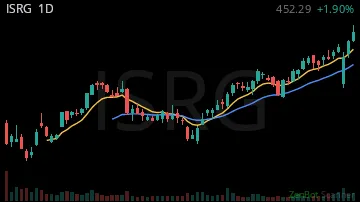
ISRG452.30 +0.02%
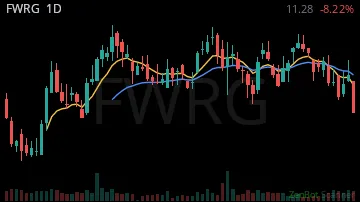
FWRG10.88 -0.06%
AJG268.44 -0.01%

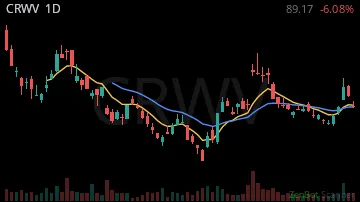
CRWV54.23 -0.02%
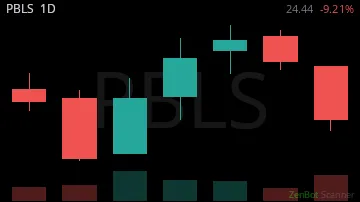
PBLS24.44 -0.09%
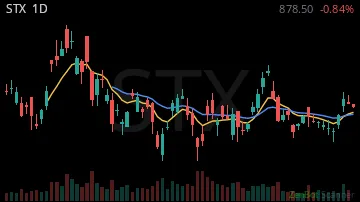
STX630.46 -0.02%
RSG240.43 -0.01%

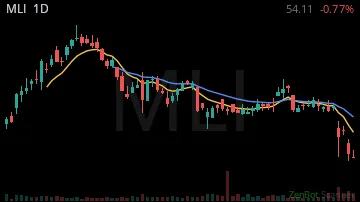
MLI54.11 -0.01%
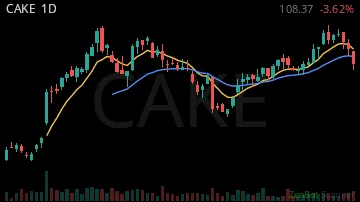
CAKE108.40 -0.04%
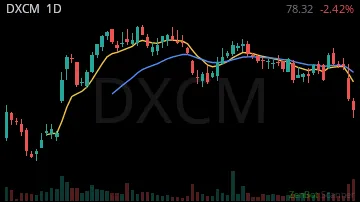
DXCM77.93 0.00%
BKV20.37 -0.02%

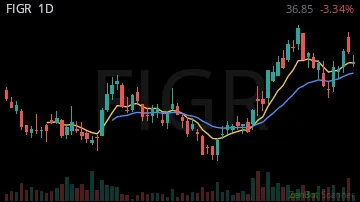
FIGR23.18 -0.04%
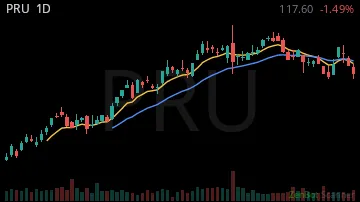
PRU115.00 -0.03%
| Symbol | Chart | Sector | Last | Chg % | Chg $ | RS 1H | RS 2W | RVOL | Vol |
|---|---|---|---|---|---|---|---|---|---|
| LKQ |  | Consumer Dis | 17.41 | -0.23% | -5.07 | 0.00 | 2.25 | 637% | 23.4M |
| SLM | 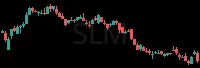 | Finance | 19.42 | -0.11% | -2.35 | 0.00 | 0.98 | 530% | 13.0M |
| TNGX | 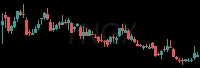 | Health Care | 23.33 | -0.16% | -4.60 | 0.00 | 5.68 | 471% | 15.9M |
| FLG | 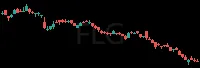 | Finance | 10.37 | -0.09% | -1.07 | 0.00 | 1.71 | 448% | 24.2M |
| CCI | 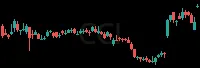 | Real Estate | 85.99 | +0.09% | +7.16 | 0.00 | 5.45 | 424% | 17.3M |
| NMZ | 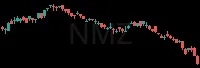 | Finance | 8.64 | -0.05% | -0.41 | 0.00 | 2.81 | 423% | 5.5M |
| AMT | 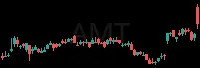 | Real Estate | 188.97 | +0.04% | +7.40 | 0.00 | 5.31 | 315% | 8.9M |
| RCUS | 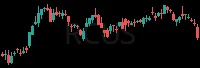 | Health Care | 18.52 | -0.04% | -0.84 | 0.00 | -0.61 | 312% | 5.9M |
| RNG | 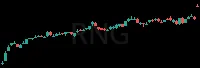 | Technology | 83.39 | +0.05% | +3.97 | 0.00 | 2.70 | 295% | 4.6M |
| IEP | 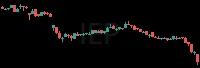 | Energy | 5.77 | -0.06% | -0.37 | 0.00 | -1.73 | 266% | 3.0M |
| CORT | 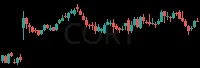 | Health Care | 85.84 | -0.20% | -21.66 | 0.00 | -0.28 | 260% | 3.1M |
| FR | 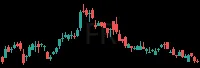 | Real Estate | 54.46 | -0.02% | -0.83 | 0.00 | -0.47 | 259% | 3.0M |
| INFY |  | Technology | 12.31 | -0.07% | -0.91 | 0.00 | 8.42 | 249% | 46.0M |
| MBLY | 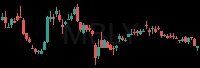 | Technology | 6.54 | -0.06% | -0.42 | 0.00 | 0.64 | 247% | 13.3M |
| MXL | 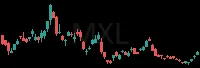 | Technology | 63.47 | -0.03% | -1.81 | 0.00 | -3.03 | 241% | 7.2M |
| TSCO | 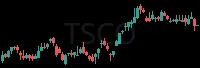 | Consumer Dis | 33.41 | -0.04% | -1.32 | 0.00 | 3.96 | 240% | 26.8M |
| T | 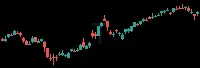 | Telecommunic | 20.93 | -0.08% | -1.81 | 0.00 | 0.10 | 239% | 99.8M |
| BE |  | Energy | 193.12 | -0.11% | -24.65 | 0.00 | -1.98 | 237% | 36.0M |
| CBRE | 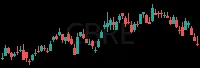 | Finance | 123.30 | -0.06% | -7.94 | 0.00 | 2.26 | 224% | 4.6M |
| NUV | 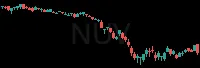 | Finance | 8.26 | -0.02% | -0.14 | 0.00 | 3.39 | 212% | 2.4M |
| NVS |  | Health Care | 151.09 | -0.03% | -5.19 | 0.00 | 8.21 | 209% | 4.4M |
| ORI |  | Finance | 38.91 | -0.03% | -1.17 | 0.00 | 4.83 | 207% | 3.1M |
| LGN | 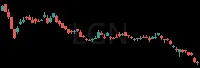 | Consumer Dis | 36.07 | -0.02% | -0.79 | 0.00 | -3.55 | 204% | 2.2M |
| ZURA | 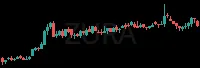 | Health Care | 3.36 | -0.05% | -0.18 | 0.00 | 1.14 | 204% | 5.8M |
| CCCC | 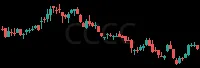 | Health Care | 3.06 | -0.04% | -0.13 | 0.00 | 3.55 | 202% | 4.7M |
| OMC | 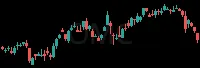 | Telecommunic | 82.66 | 0.00% | +0.10 | 0.00 | 5.77 | 196% | 5.3M |
| NAC | 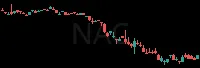 | Finance | 9.90 | -0.03% | -0.26 | 0.00 | 2.67 | 195% | 2.3M |
| IVZ | 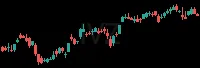 | Finance | 28.06 | -0.03% | -0.73 | 0.00 | 0.47 | 194% | 8.3M |
| MET |  | Finance | 98.82 | -0.05% | -4.76 | 0.00 | 5.32 | 193% | 6.0M |
| GFL | 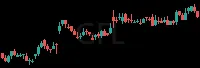 | Utilities | 45.53 | +0.03% | +1.39 | 0.00 | 3.61 | 189% | 6.3M |
| MLCO | 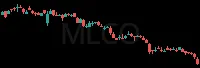 | Consumer Dis | 3.75 | -0.05% | -0.21 | 0.00 | 0.10 | 184% | 3.3M |
| HWM | 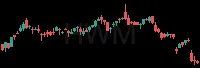 | Industrials | 185.54 | -0.04% | -7.75 | 0.00 | -2.59 | 180% | 6.0M |
| RPD | 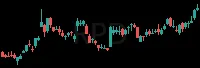 | Technology | 14.90 | +0.01% | +0.17 | 0.00 | 4.79 | 178% | 3.1M |
| WDC |  | Technology | 343.54 | -0.03% | -10.65 | 0.00 | -0.55 | 177% | 14.1M |
| HESM | 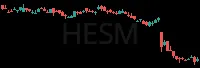 | Energy | 30.61 | +0.02% | +0.57 | 0.00 | -3.77 | 171% | 3.5M |
| NZF | 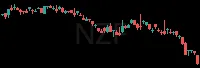 | Finance | 10.94 | -0.01% | -0.11 | 0.00 | 2.98 | 171% | 1.9M |
| SSNC |  | Technology | 82.95 | -0.07% | -6.59 | 0.00 | 8.69 | 169% | 2.5M |
| VRSK | 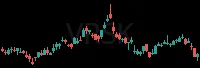 | Technology | 195.81 | -0.04% | -7.52 | 0.00 | 8.31 | 168% | 2.0M |
| ZGN |  | Consumer Dis | 13.49 | -0.03% | -0.36 | 0.00 | 4.95 | 168% | 1.9M |
| OXLC | 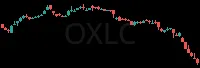 | Finance | 6.78 | -0.03% | -0.22 | 0.00 | -3.49 | 167% | 1.8M |
| GEV | 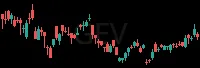 | Technology | 814.70 | -0.02% | -12.72 | 0.00 | -1.79 | 166% | 3.9M |
| GGG |  | Industrials | 66.98 | -0.03% | -2.30 | 0.00 | -1.99 | 164% | 3.4M |
| COCO | 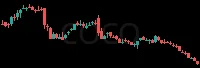 | Consumer Sta | 56.45 | -0.04% | -2.55 | 0.00 | 3.53 | 164% | 2.1M |
| TMUS | 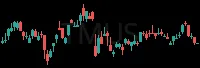 | Telecommunic | 146.61 | -0.08% | -12.18 | 0.00 | 0.98 | 163% | 8.6M |
| VET | 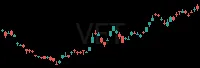 | Energy | 13.92 | +0.03% | +0.47 | 0.00 | 6.05 | 162% | 2.3M |
| PNFP |  | Finance | 100.41 | 0.00% | -0.05 | 0.00 | 3.92 | 160% | 1.7M |
| BLMN | 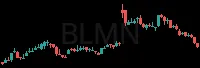 | Consumer Dis | 9.20 | -0.10% | -1.07 | 0.00 | 6.19 | 158% | 3.7M |
| CRDO |  | Technology | 147.27 | -0.10% | -15.50 | 0.00 | -1.49 | 156% | 12.7M |
| ATEC | 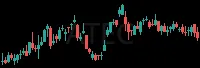 | Health Care | 11.11 | -0.02% | -0.26 | 0.00 | 3.74 | 155% | 3.3M |
| NAMS | 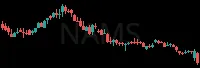 | Health Care | 19.72 | -0.09% | -1.86 | 0.00 | 1.50 | 155% | 2.3M |
| UNIT | 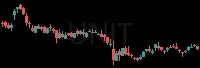 | Real Estate | 5.06 | -0.03% | -0.13 | 0.00 | -4.87 | 155% | 4.4M |
| PPTA |  | Basic Materi | 16.43 | -0.05% | -0.83 | 0.00 | -0.95 | 154% | 1.6M |
| RES | 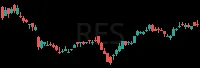 | Energy | 6.25 | +0.04% | +0.23 | 0.00 | 2.04 | 153% | 3.0M |
| LBRT |  | Energy | 15.58 | +0.01% | +0.20 | 0.00 | -2.30 | 152% | 6.1M |
| DAN | 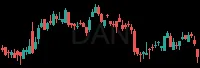 | Consumer Dis | 26.80 | -0.05% | -1.44 | 0.00 | 1.92 | 150% | 2.1M |
| PENG | 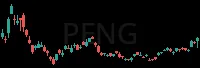 | Technology | 53.38 | +0.03% | +1.47 | 0.00 | 0.39 | 147% | 4.4M |
| AMBP | 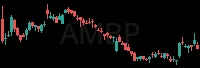 | Industrials | 4.55 | -0.04% | -0.18 | 0.00 | 3.99 | 147% | 2.8M |
| USA | 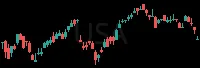 | Finance | 5.93 | 0.00% | -0.03 | 0.00 | 3.09 | 146% | 1.6M |
| IBKR | 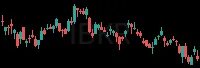 | Finance | 80.27 | -0.02% | -2.01 | 0.00 | -0.56 | 146% | 5.8M |
| MS | 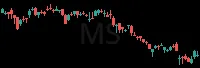 | Finance | 179.86 | -0.02% | -4.11 | 0.00 | 0.77 | 145% | 7.6M |
| MGM | 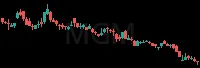 | Consumer Dis | 28.04 | -0.05% | -1.47 | 0.00 | 0.96 | 145% | 5.7M |
| SGRY | 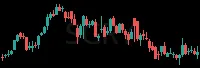 | Health Care | 15.76 | -0.01% | -0.14 | 0.00 | 6.59 | 145% | 3.3M |
| INSM | 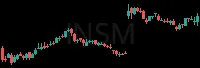 | Health Care | 93.46 | -0.02% | -1.61 | 0.00 | -0.92 | 144% | 3.4M |
| BXSL |  | Finance | 23.34 | -0.02% | -0.58 | 0.00 | 3.04 | 144% | 2.0M |
| SE |  | Consumer Dis | 74.64 | -0.01% | -1.05 | 0.00 | -3.33 | 143% | 6.7M |
| CLS |  | Technology | 260.00 | -0.03% | -9.01 | 0.00 | -3.21 | 142% | 3.1M |
| TVTX | 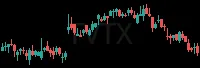 | Health Care | 50.05 | -0.05% | -2.38 | 0.00 | 0.60 | 141% | 2.3M |
| CENX | 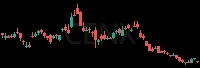 | Industrials | 31.42 | -0.04% | -1.23 | 0.00 | -0.66 | 140% | 2.7M |
| FUN | 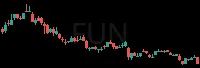 | Consumer Dis | 6.77 | -0.07% | -0.48 | 0.00 | -3.96 | 140% | 4.7M |
| PENN |  | Consumer Dis | 14.50 | -0.06% | -0.96 | 0.00 | 1.28 | 139% | 4.1M |
| BEP | 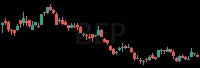 | Utilities | 28.48 | -0.01% | -0.43 | 0.00 | 1.49 | 139% | 1.4M |
| SVRA | 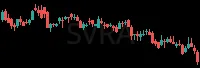 | Health Care | 4.22 | -0.07% | -0.33 | 0.00 | 1.72 | 139% | 2.8M |
| AXP | 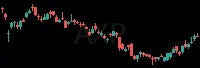 | Finance | 313.23 | -0.04% | -11.95 | 0.00 | 5.59 | 137% | 4.1M |
| ARMK | 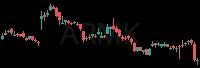 | Consumer Dis | 52.56 | 0.00% | +0.04 | 0.00 | -0.30 | 137% | 3.2M |
| NDAQ | 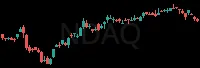 | Finance | 102.61 | -0.01% | -0.69 | 0.00 | 7.11 | 136% | 4.2M |
| BHVN | 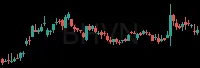 | Health Care | 13.87 | -0.06% | -0.82 | 0.00 | 4.79 | 136% | 4.7M |
| RMBS | 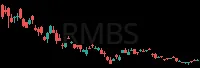 | Technology | 85.61 | 0.00% | -0.12 | 0.00 | -2.71 | 136% | 2.9M |
| HSY |  | Consumer Sta | 169.64 | -0.03% | -6.00 | 0.00 | 6.28 | 135% | 1.9M |
| PUMP | 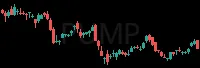 | Energy | 7.29 | +0.01% | +0.07 | 0.00 | -2.90 | 135% | 5.3M |
| AVT | 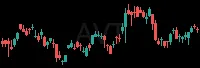 | Technology | 88.03 | -0.01% | -0.61 | 0.00 | -2.52 | 135% | 1.7M |
| WTTR | 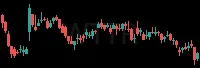 | Energy | 18.15 | +0.03% | +0.61 | 0.00 | -1.03 | 135% | 2.1M |
| FPS | 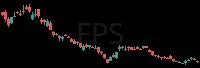 | Energy | 24.22 | -0.03% | -0.71 | 0.00 | -3.31 | 134% | 12.2M |
| EPRT | 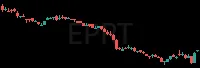 | Real Estate | 26.64 | +0.01% | +0.38 | 0.00 | 3.20 | 134% | 3.1M |
| RDY | 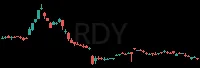 | Health Care | 13.19 | 0.00% | -0.04 | 0.00 | 5.01 | 134% | 3.9M |
| GRNT | 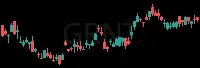 | Energy | 5.86 | +0.04% | +0.21 | 0.00 | 6.80 | 134% | 1.9M |
| HTHT | 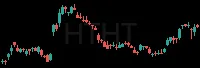 | Consumer Dis | 46.22 | 0.00% | -0.10 | 0.00 | 5.66 | 132% | 2.1M |
| USFD | 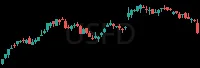 | Consumer Dis | 100.95 | -0.03% | -3.10 | 0.00 | 5.69 | 132% | 2.8M |
| ISRG | 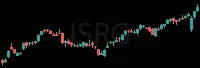 | Health Care | 452.30 | +0.02% | +8.45 | 0.00 | 5.20 | 130% | 3.0M |
| FWRG |  | Consumer Dis | 10.88 | -0.06% | -0.68 | 0.00 | 3.76 | 130% | 1.7M |
| AJG | 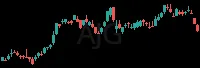 | Finance | 268.44 | -0.01% | -2.55 | 0.00 | 8.18 | 130% | 1.8M |
| CRWV | 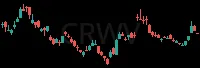 | Technology | 54.23 | -0.02% | -1.37 | 0.00 | -3.27 | 130% | 47.7M |
| PBLS |  | Health Care | 24.44 | -0.09% | -2.49 | 0.00 | 0.00 | 129% | 1.8M |
| STX |  | Technology | 630.46 | -0.02% | -11.69 | 0.00 | -1.49 | 129% | 5.6M |
| RSG | 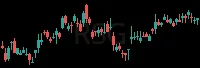 | Utilities | 240.43 | -0.01% | -1.47 | 0.00 | 8.14 | 129% | 1.9M |
| MLI | 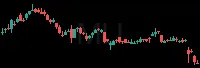 | Industrials | 54.11 | -0.01% | -0.42 | 0.00 | -2.32 | 129% | 2.1M |
| CAKE |  | Consumer Dis | 108.40 | -0.04% | -4.04 | 0.00 | 3.35 | 128% | 1.8M |
| DXCM | 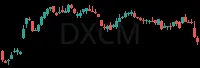 | Health Care | 77.93 | 0.00% | -0.39 | 0.00 | 0.37 | 128% | 5.2M |
| BKV |  | Energy | 20.37 | -0.02% | -0.34 | 0.00 | 0.81 | 128% | 2.6M |
| FIGR |  | Finance | 23.18 | -0.04% | -0.86 | 0.00 | 0.32 | 127% | 6.0M |
| PRU |  | Finance | 115.00 | -0.03% | -3.17 | 0.00 | 4.07 | 127% | 2.0M |
RS = relative strength vs SPY, in ATRs (1 hour / 2 weeks); green leads the market, red lags. RVOL = today's volume vs average. Prices are 15-minute delayed.
New here? How to trade these scans · More Movers scans: Price Pops - Short · Big Move Down - Short · Falling Strength · Volume Building - Short · Most Volume · Weakest