All scans · Long
Momentum Stock Scanner
Open live →ZenBot is a free real-time scanner that surfaces the stocks in play — heavy volume, leading their sector, moving before the crowd. This is one of its built-in scans.
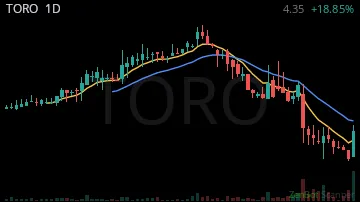
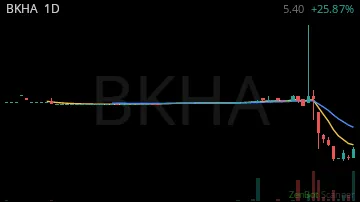
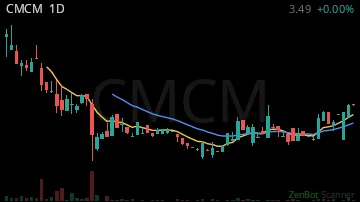
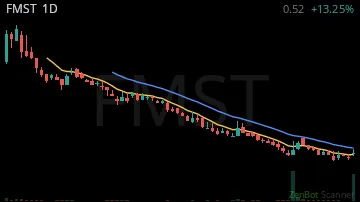
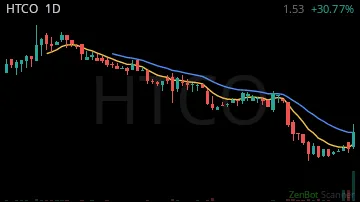
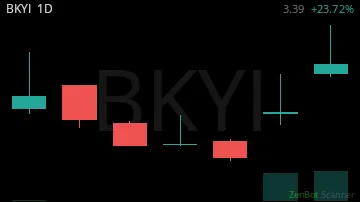
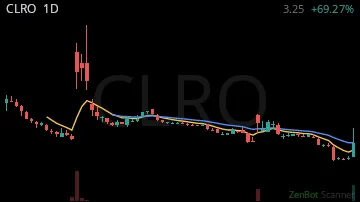
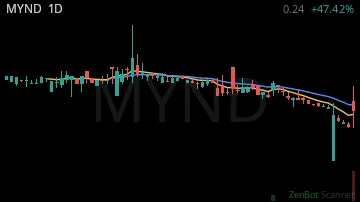
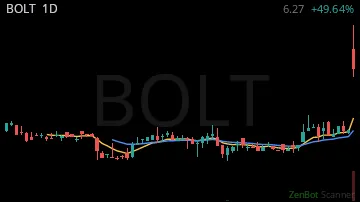
| Symbol | Chart | Sector | Last | Chg % | Chg $ | RS 1H | RS 2W | RVOL | Vol |
|---|---|---|---|---|---|---|---|---|---|
| TORO | 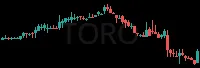 | Consumer Dis | 4.30 | +0.17% | +0.64 | 0.00 | -0.91 | 604% | 335.9K |
| BKHA |  | Health Care | 5.31 | +0.24% | +1.02 | 0.00 | -0.97 | 877% | 204.5K |
| CMCM | 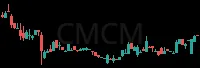 | Technology | 2.64 | +0.12% | +0.29 | 0.00 | 0.85 | 1,031% | 110.9K |
| FMST | 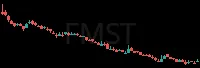 | Basic Materi | 0.51 | +0.11% | +0.05 | 0.00 | 1.70 | 1,451% | 4.6M |
| HTCO | 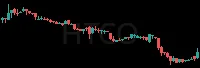 | Consumer Dis | 1.53 | +0.30% | +0.36 | 0.00 | 0.11 | 1,849% | 3.6M |
| BKYI | 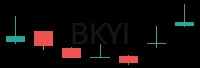 | Technology | 3.38 | +0.23% | +0.64 | 0.00 | -0.41 | 2,496% | 35.3M |
| CLRO | 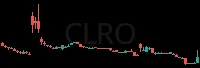 | Utilities | 3.21 | +0.67% | +1.29 | 0.00 | -2.94 | 2,594% | 36.6M |
| MYND | 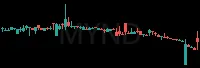 | Technology | 0.24 | +0.47% | +0.08 | 0.00 | -0.87 | 4,062% | 61.5M |
| BOLT | 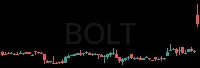 | Health Care | 6.25 | +0.49% | +2.06 | 0.00 | 3.85 | 4,513% | 12.9M |
RS = relative strength vs SPY, in ATRs (1 hour / 2 weeks); green leads the market, red lags. RVOL = today's volume vs average. Prices are 15-minute delayed.
New here? How to trade these scans · More Top Scans scans: In Play · Trending Now - Long · Top Longs · Has Trade Signal - Long · Rising Strength · Unusual Volume - Long · Strongest · Ready to Trend - Long · Opening Range - Long · Halted Now · Halt Resumed