All scans · Short
SMA Magnet - Short
Open live →ZenBot is a free real-time scanner that surfaces the stocks in play — heavy volume, leading their sector, moving before the crowd. This is one of its built-in scans.
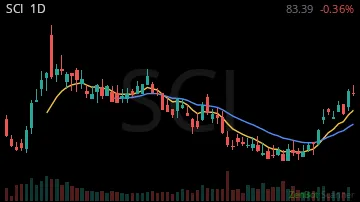
SCI80.83 +0.04%
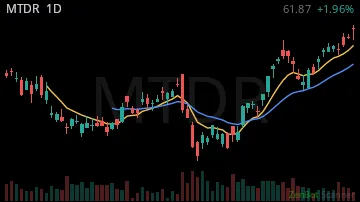
MTDR53.12 -0.05%
RPRX59.62 +0.05%

PLGO24.77 0.00%

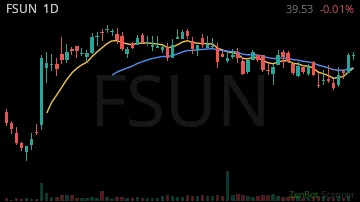
FSUN38.05 -0.01%
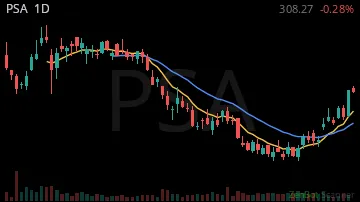
PSA295.33 +0.02%
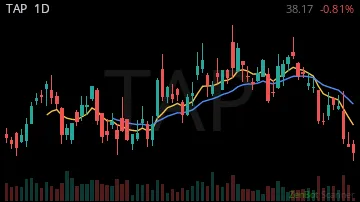
TAP39.03 +0.01%
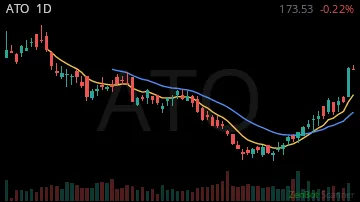
ATO163.94 0.00%
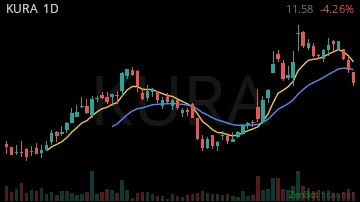
KURA9.70 -0.01%
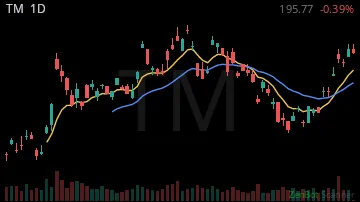
TM191.94 +0.02%
TGT156.63 +0.01%

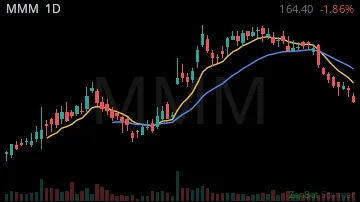
MMM164.59 +0.01%
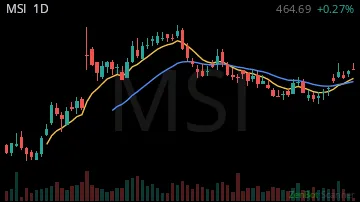
MSI456.39 +0.02%
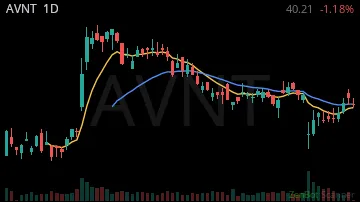
AVNT39.00 0.00%
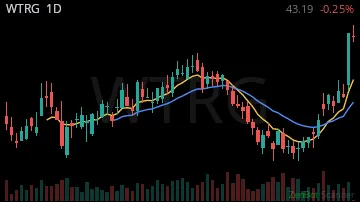
WTRG40.29 +0.01%
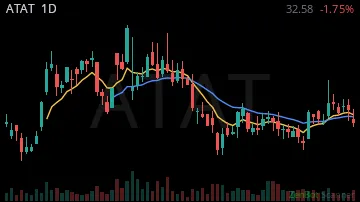
ATAT33.51 +0.03%
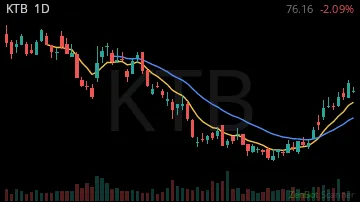
KTB73.25 +0.07%
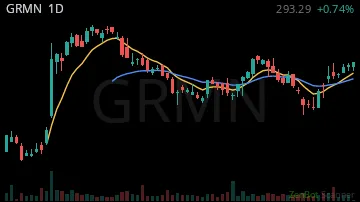
GRMN285.27 +0.03%
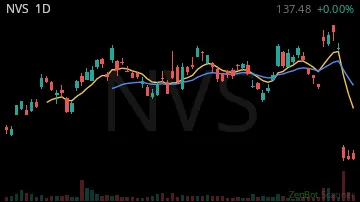
NVS150.38 +0.06%
CNA47.31 0.00%

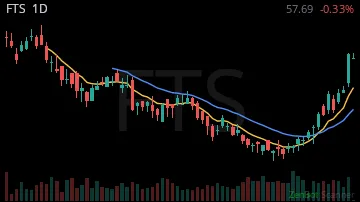
FTS54.66 +0.01%
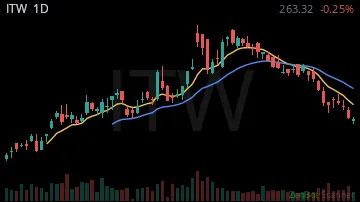
ITW271.19 +0.02%
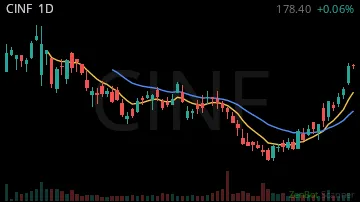
CINF167.22 0.00%
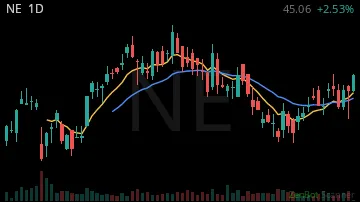
NE42.91 -0.01%
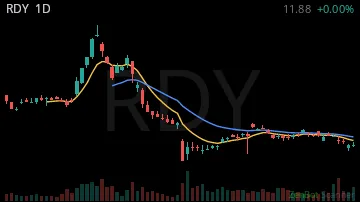
RDY12.90 +0.01%
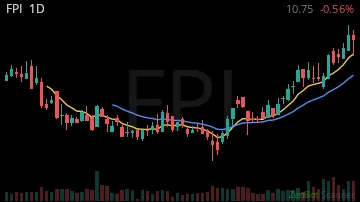
FPI10.55 -0.01%
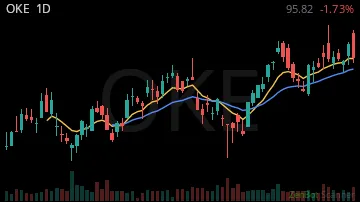
OKE90.75 -0.03%
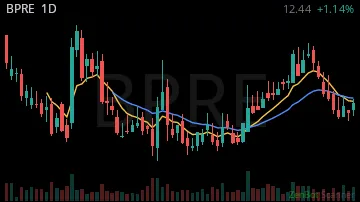
BPRE12.49 0.00%
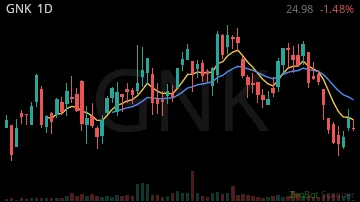
GNK24.30 -0.08%
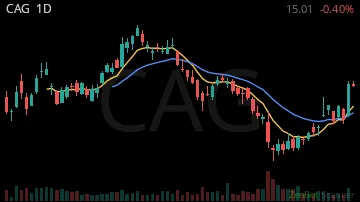
CAG14.17 +0.02%
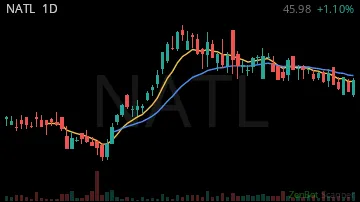
NATL46.06 0.00%
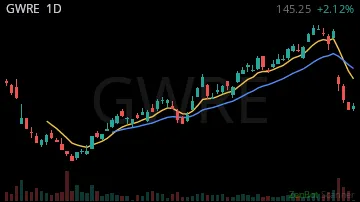
GWRE168.04 +0.01%
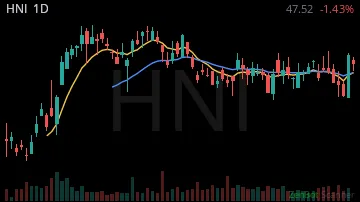
HNI47.05 -0.01%
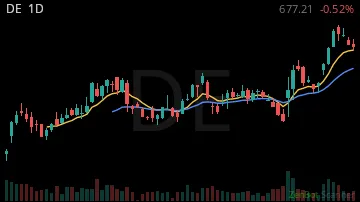
DE661.00 +0.02%
MDLN36.06 +0.01%

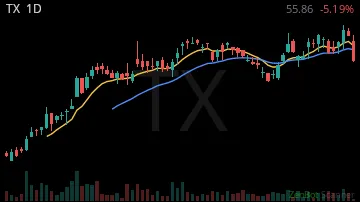
TX56.88 -0.03%
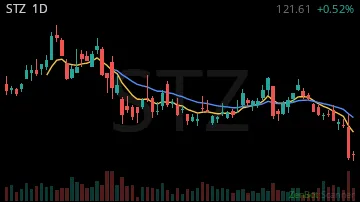
STZ129.58 +0.02%
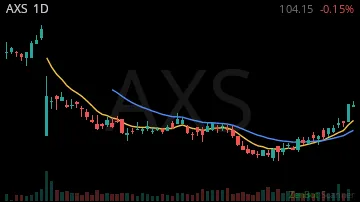
AXS97.93 0.00%
ABT104.00 +0.01%

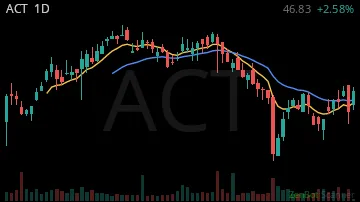
ACT45.74 +0.01%
VCYT44.39 +0.02%

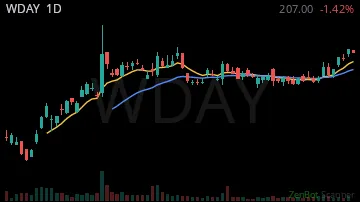
WDAY193.29 +0.02%
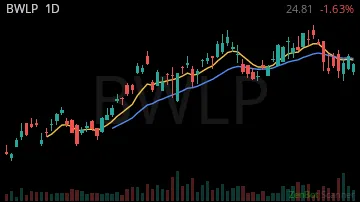
BWLP24.48 -0.02%
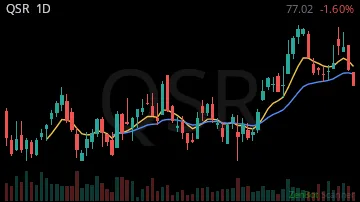
QSR74.11 +0.04%
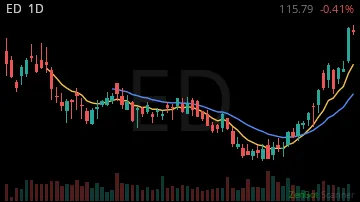
ED109.86 0.00%
PAA25.12 +0.01%

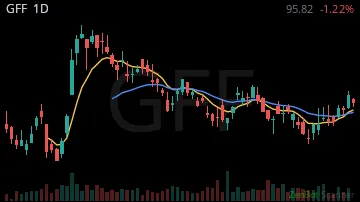
GFF93.21 +0.01%
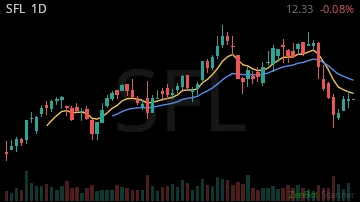
SFL12.61 -0.07%
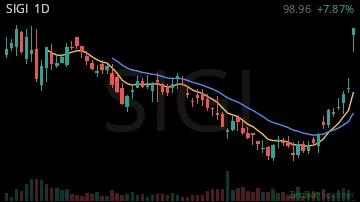
SIGI87.54 +0.03%
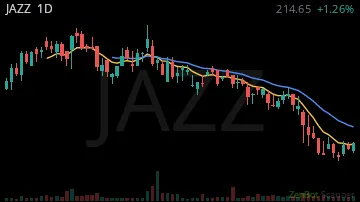
JAZZ216.17 +0.03%
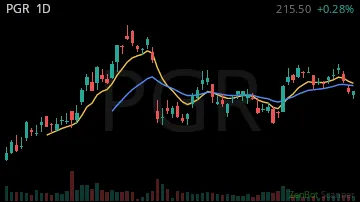
PGR213.75 -0.04%
RBA86.50 -0.02%

BUD81.28 +0.02%

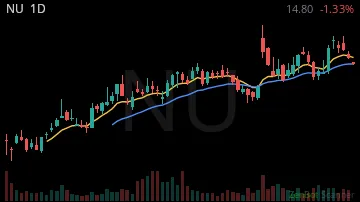
NU14.75 -0.05%
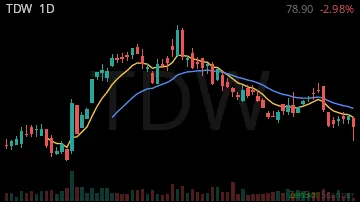
TDW79.71 -0.04%
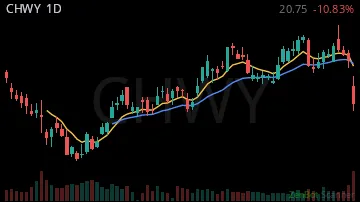
CHWY21.15 +0.02%
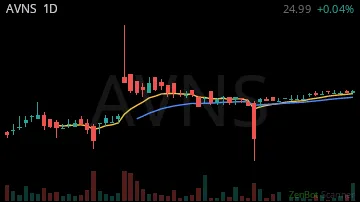
AVNS25.01 0.00%
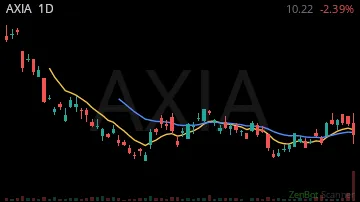
AXIA10.36 +0.01%
GBTG9.49 0.00%

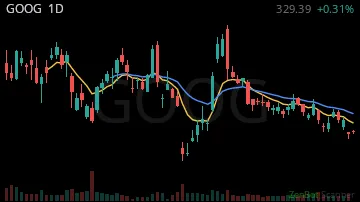
GOOG344.60 -0.01%
ALL239.60 +0.01%

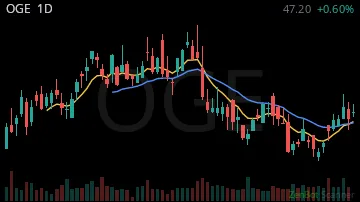
OGE47.05 0.00%
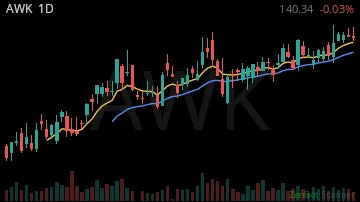
AWK133.04 +0.01%
GSL42.00 -0.07%

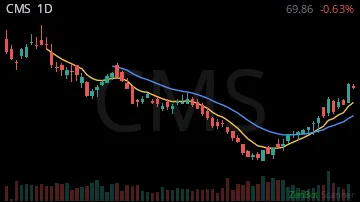
CMS67.21 +0.01%
CROX124.77 +0.06%
SLG47.09 -0.04%
ROST234.83 +0.04%
EXE90.40 -0.02%
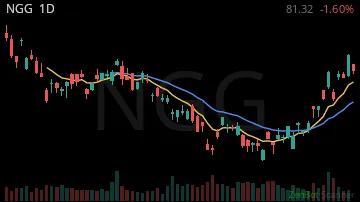
NGG79.11 +0.01%
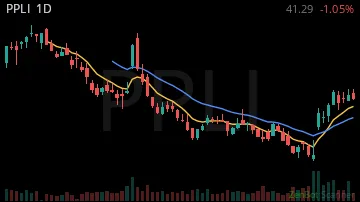
PPLI40.16 -0.02%
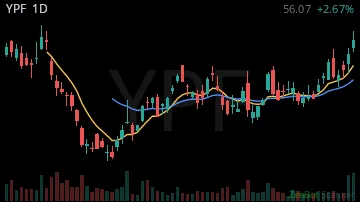
YPF52.11 0.00%
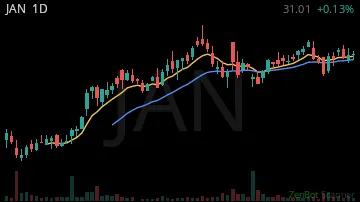
JAN29.30 +0.02%
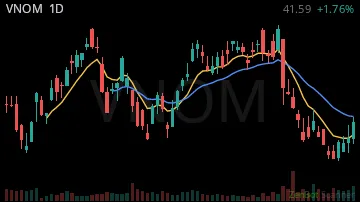
VNOM44.25 0.00%
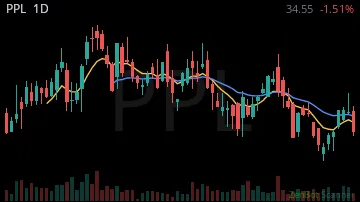
PPL34.48 0.00%
NSIT158.90 -0.10%

AJG250.10 +0.06%

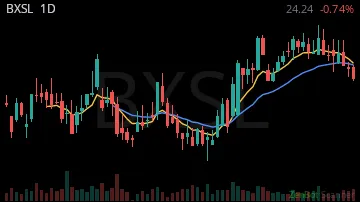
BXSL24.19 +0.02%
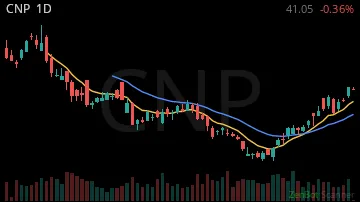
CNP39.78 0.00%
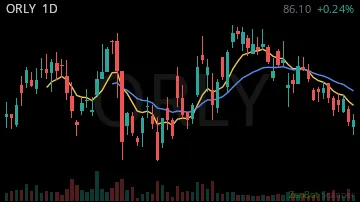
ORLY88.50 +0.03%
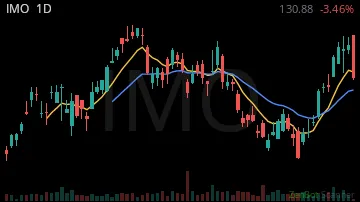
IMO129.59 +0.01%
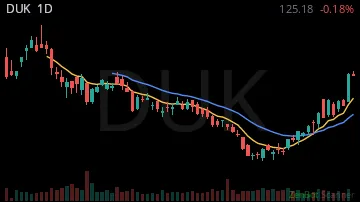
DUK119.04 -0.01%
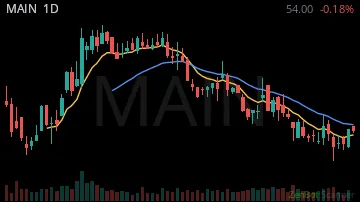
MAIN54.50 +0.01%
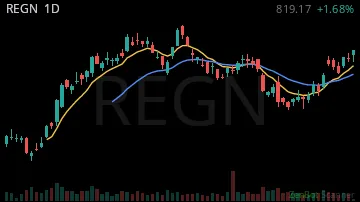
REGN796.34 +0.06%
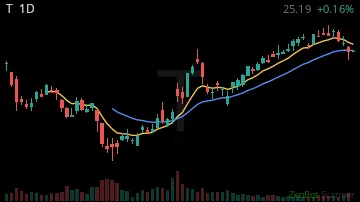
T23.49 +0.02%
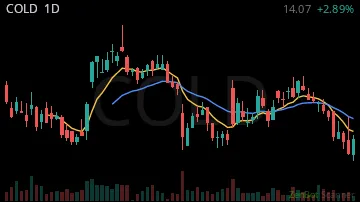
COLD13.92 +0.01%
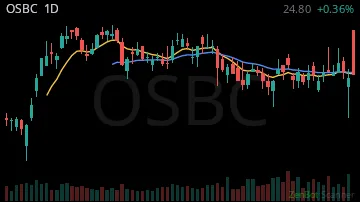
OSBC24.85 0.00%
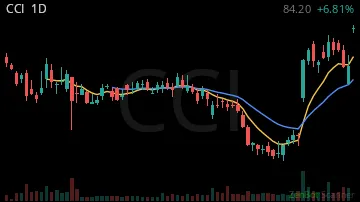
CCI78.88 -0.01%
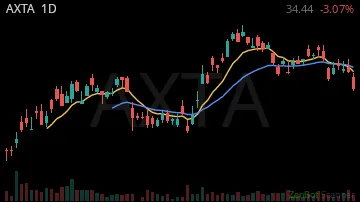
AXTA33.73 +0.02%
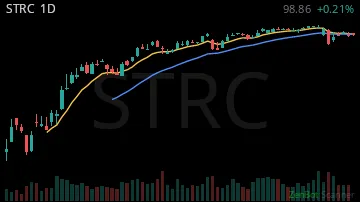
STRC99.32 -0.01%
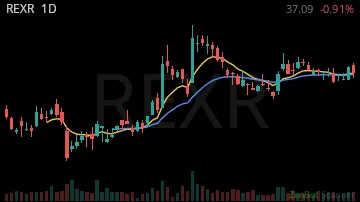
REXR37.00 -0.02%
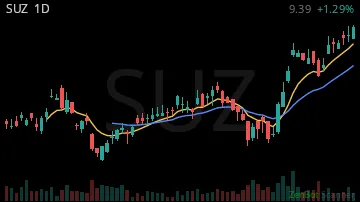
SUZ8.35 -0.02%
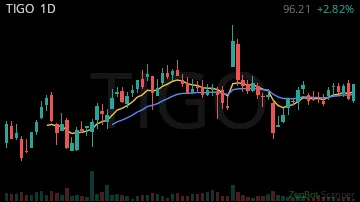
TIGO82.07 +0.02%
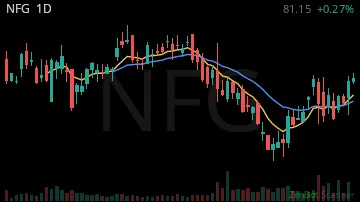
NFG78.38 -0.03%
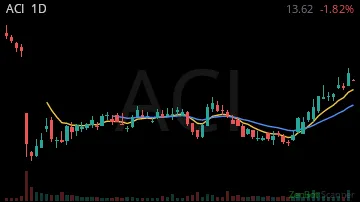
ACI13.02 0.00%
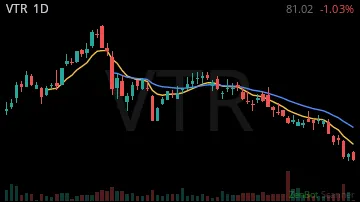
VTR84.59 0.00%
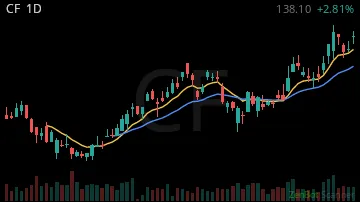
CF119.80 0.00%
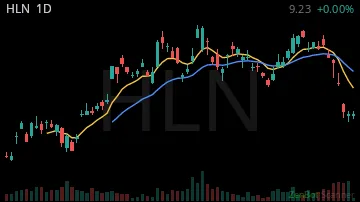
HLN9.95 +0.05%
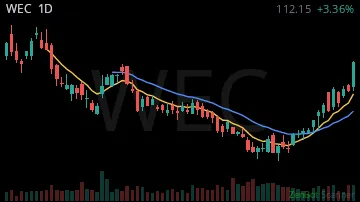
WEC105.97 -0.01%
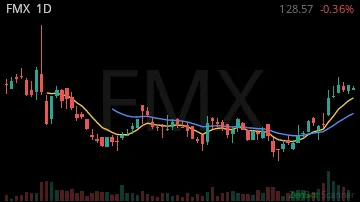
FMX120.99 0.00%
| Symbol | Chart | Sector | Last | Chg % | Chg $ | RS 1H | RS 2W | RVOL | Vol |
|---|---|---|---|---|---|---|---|---|---|
| SCI |  | Consumer Dis | 80.83 | +0.04% | +3.00 | -3.07 | -1.12 | 81% | 1.3M |
| MTDR |  | Energy | 53.12 | -0.05% | -2.76 | -8.34 | 1.71 | 81% | 1.5M |
| RPRX |  | Health Care | 59.62 | +0.05% | +3.05 | -1.53 | -2.57 | 81% | 3.4M |
| PLGO |  | Finance | 24.77 | 0.00% | +0.11 | 0.83 | 0.37 | 81% | 395.5K |
| FSUN | 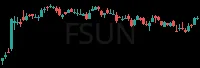 | Finance | 38.05 | -0.01% | -0.29 | -0.81 | -2.77 | 82% | 358.8K |
| PSA | 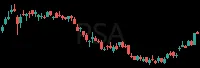 | Real Estate | 295.33 | +0.02% | +6.94 | -1.22 | -1.04 | 82% | 1.2M |
| TAP |  | Consumer Sta | 39.03 | +0.01% | +0.40 | 0.00 | 1.80 | 82% | 3.3M |
| ATO | 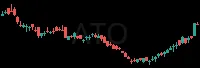 | Utilities | 163.94 | 0.00% | 0.00 | -0.13 | 2.42 | 83% | 887.1K |
| KURA | 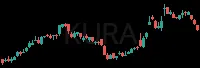 | Health Care | 9.70 | -0.01% | -0.13 | -1.53 | -3.18 | 84% | 1.7M |
| TM | 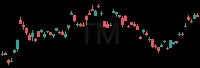 | Consumer Dis | 191.94 | +0.02% | +3.34 | -6.99 | -0.53 | 85% | 358.9K |
| TGT | 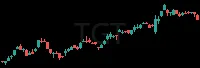 | Consumer Sta | 156.63 | +0.01% | +1.32 | 0.00 | -1.49 | 86% | 3.5M |
| MMM | 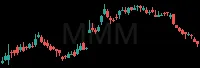 | Health Care | 164.59 | +0.01% | +1.82 | -1.30 | -3.10 | 86% | 3.6M |
| MSI | 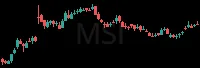 | Technology | 456.39 | +0.02% | +7.38 | 0.60 | -2.23 | 86% | 799.3K |
| AVNT | 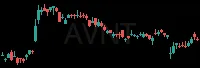 | Industrials | 39.00 | 0.00% | +0.15 | -0.54 | -2.32 | 87% | 1.2M |
| WTRG | 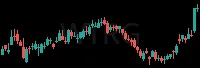 | Utilities | 40.29 | +0.01% | +0.44 | -1.94 | 0.53 | 87% | 4.5M |
| ATAT | 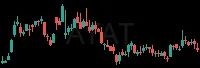 | Consumer Dis | 33.51 | +0.03% | +0.89 | -0.98 | -0.84 | 87% | 1.0M |
| KTB | 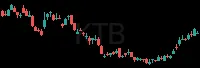 | Industrials | 73.25 | +0.07% | +4.78 | -2.87 | 0.49 | 87% | 1.0M |
| GRMN | 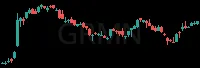 | Industrials | 285.27 | +0.03% | +8.86 | -3.14 | -3.46 | 88% | 1.1M |
| NVS | 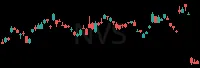 | Health Care | 150.38 | +0.06% | +7.97 | -4.54 | -2.61 | 88% | 2.1M |
| CNA |  | Finance | 47.31 | 0.00% | +0.07 | -0.88 | 1.43 | 88% | 618.3K |
| FTS | 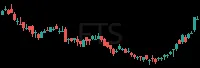 | Utilities | 54.66 | +0.01% | +0.63 | -5.53 | 0.39 | 88% | 903.5K |
| ITW | 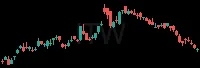 | Industrials | 271.19 | +0.02% | +4.87 | -2.66 | -2.51 | 89% | 1.4M |
| CINF | 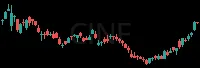 | Finance | 167.22 | 0.00% | +0.55 | 0.26 | 1.21 | 89% | 746.2K |
| NE | 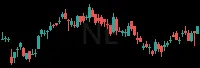 | Energy | 42.91 | -0.01% | -0.51 | -2.56 | -0.70 | 89% | 1.5M |
| RDY | 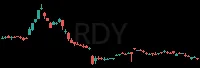 | Health Care | 12.90 | +0.01% | +0.13 | -3.00 | 0.55 | 90% | 2.7M |
| FPI |  | Real Estate | 10.55 | -0.01% | -0.08 | -0.06 | -1.76 | 90% | 784.6K |
| OKE | 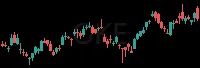 | Utilities | 90.75 | -0.03% | -2.63 | -0.11 | 0.91 | 90% | 3.2M |
| BPRE | 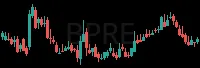 | 12.49 | 0.00% | -0.06 | -0.89 | -0.41 | 90% | 805.7K | |
| GNK | 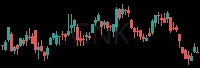 | Consumer Dis | 24.30 | -0.08% | -2.25 | -5.59 | -0.55 | 91% | 611.1K |
| CAG | 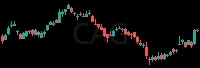 | Consumer Sta | 14.17 | +0.02% | +0.33 | -8.06 | -1.37 | 92% | 11.0M |
| NATL | 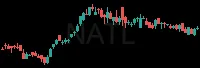 | Miscellaneou | 46.06 | 0.00% | +0.01 | -6.69 | -1.17 | 92% | 889.5K |
| GWRE | 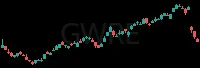 | Technology | 168.04 | +0.01% | +2.26 | -8.44 | 1.83 | 92% | 1.6M |
| HNI | 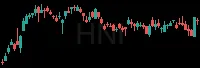 | Consumer Dis | 47.05 | -0.01% | -0.67 | -3.81 | -0.74 | 92% | 695.0K |
| DE |  | Industrials | 661.00 | +0.02% | +10.62 | 5.79 | -2.60 | 93% | 1.2M |
| MDLN | 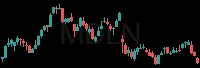 | Health Care | 36.06 | +0.01% | +0.36 | -13.84 | -0.13 | 93% | 7.7M |
| TX | 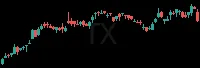 | Industrials | 56.88 | -0.03% | -1.67 | -2.18 | 1.74 | 93% | 598.3K |
| STZ | 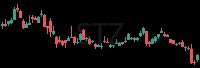 | Consumer Sta | 129.58 | +0.02% | +2.52 | 3.63 | 3.19 | 93% | 2.1M |
| AXS | 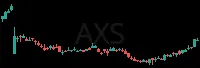 | Finance | 97.93 | 0.00% | -0.13 | -1.15 | 1.35 | 93% | 828.5K |
| ABT |  | Health Care | 104.00 | +0.01% | +1.03 | -4.41 | 0.21 | 93% | 12.7M |
| ACT | 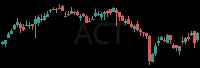 | Finance | 45.74 | +0.01% | +0.53 | 1.50 | -2.05 | 93% | 360.5K |
| VCYT | 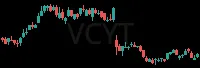 | Health Care | 44.39 | +0.02% | +0.88 | -5.33 | -1.35 | 93% | 1.2M |
| WDAY | 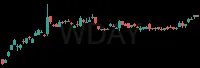 | Technology | 193.29 | +0.02% | +4.52 | -5.00 | -0.61 | 93% | 3.2M |
| BWLP | 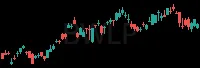 | Consumer Dis | 24.48 | -0.02% | -0.41 | -0.10 | -0.36 | 95% | 461.6K |
| QSR | 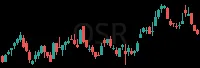 | Consumer Dis | 74.11 | +0.04% | +2.84 | -1.23 | -1.39 | 95% | 4.5M |
| ED | 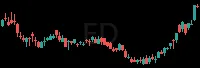 | Utilities | 109.86 | 0.00% | +0.26 | -5.16 | 3.21 | 96% | 3.2M |
| PAA | 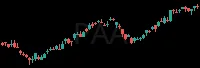 | Energy | 25.12 | +0.01% | +0.20 | -6.07 | -0.13 | 97% | 2.5M |
| GFF | 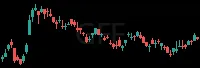 | Industrials | 93.21 | +0.01% | +0.98 | -3.97 | -3.54 | 97% | 500.8K |
| SFL | 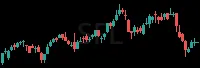 | Consumer Dis | 12.61 | -0.07% | -0.97 | 3.04 | 0.98 | 98% | 1.3M |
| SIGI | 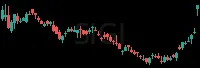 | Finance | 87.54 | +0.03% | +2.39 | -1.66 | -1.73 | 98% | 669.0K |
| JAZZ | 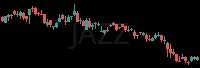 | Health Care | 216.17 | +0.03% | +5.78 | 15.68 | -4.80 | 98% | 886.5K |
| PGR |  | Finance | 213.75 | -0.04% | -9.13 | -5.36 | 3.18 | 99% | 3.5M |
| RBA | 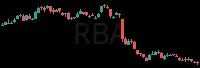 | Consumer Dis | 86.50 | -0.02% | -1.72 | -1.73 | 1.26 | 99% | 2.2M |
| BUD |  | Consumer Sta | 81.28 | +0.02% | +1.78 | 0.00 | 0.97 | 99% | 2.1M |
| NU | 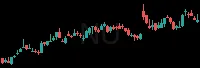 | Finance | 14.75 | -0.05% | -0.83 | -0.51 | 1.90 | 99% | 76.1M |
| TDW | 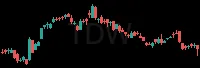 | Consumer Dis | 79.71 | -0.04% | -3.07 | 6.51 | -0.82 | 100% | 592.1K |
| CHWY | 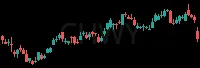 | Consumer Dis | 21.15 | +0.02% | +0.32 | -3.75 | 2.43 | 100% | 8.5M |
| AVNS | 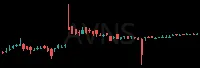 | Health Care | 25.01 | 0.00% | +0.02 | 0.00 | 3.56 | 100% | 0 |
| AXIA | 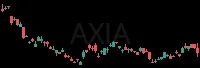 | Utilities | 10.36 | +0.01% | +0.14 | 0.00 | -1.39 | 100% | 0 |
| GBTG |  | Consumer Dis | 9.49 | 0.00% | -0.01 | 0.00 | -0.24 | 100% | 0 |
| GOOG | 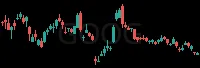 | Telecommunic | 344.60 | -0.01% | -4.92 | 0.81 | 0.01 | 101% | 16.6M |
| ALL | 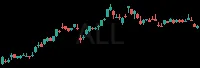 | Finance | 239.60 | +0.01% | +3.43 | 1.36 | 1.33 | 101% | 2.1M |
| OGE |  | Utilities | 47.05 | 0.00% | -0.16 | -1.93 | 1.80 | 101% | 2.3M |
| AWK |  | Utilities | 133.04 | +0.01% | +1.33 | -3.65 | 0.44 | 102% | 3.1M |
| GSL |  | Consumer Dis | 42.00 | -0.07% | -3.19 | 2.01 | -0.35 | 102% | 396.2K |
| CMS | 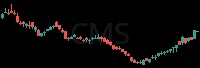 | Utilities | 67.21 | +0.01% | +0.39 | -0.59 | 3.38 | 102% | 5.0M |
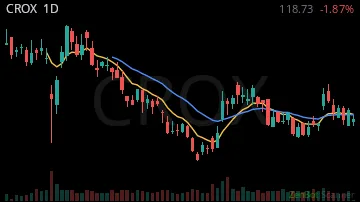
| CROX | 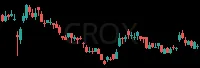 | Consumer Dis | 124.77 | +0.06% | +7.23 | -5.37 | -1.99 | 102% | 1.5M |
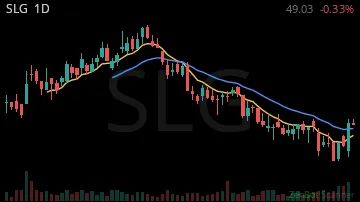
| SLG | 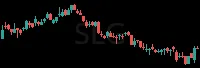 | Real Estate | 47.09 | -0.04% | -1.82 | -0.96 | -2.48 | 103% | 1.3M |
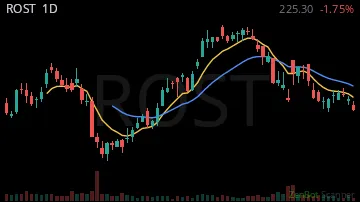
| ROST | 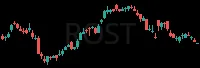 | Consumer Dis | 234.83 | +0.04% | +9.15 | 2.57 | -3.18 | 103% | 2.4M |
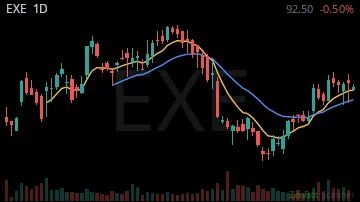
| EXE | 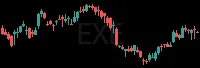 | Energy | 90.40 | -0.02% | -1.97 | -12.75 | 1.60 | 103% | 3.0M |
| NGG |  | Utilities | 79.11 | +0.01% | +0.88 | -4.57 | 1.26 | 103% | 1.1M |
| PPLI | 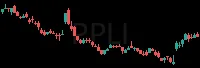 | Technology | 40.16 | -0.02% | -0.68 | -2.19 | -0.43 | 104% | 1.5M |
| YPF | 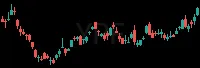 | Energy | 52.11 | 0.00% | -0.14 | 5.08 | -0.10 | 104% | 1.3M |
| JAN | 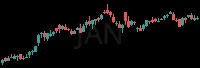 | Real Estate | 29.30 | +0.02% | +0.45 | 2.16 | -2.65 | 104% | 1.9M |
| VNOM |  | Energy | 44.25 | 0.00% | +0.12 | 15.48 | 2.86 | 104% | 1.9M |
| PPL | 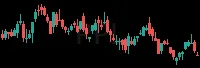 | Utilities | 34.48 | 0.00% | -0.15 | -1.22 | 3.87 | 105% | 7.9M |
| NSIT |  | Consumer Dis | 158.90 | -0.10% | -16.97 | 0.31 | 2.44 | 106% | 497.5K |
| AJG | 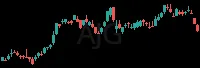 | Finance | 250.10 | +0.06% | +13.06 | -2.13 | 0.72 | 106% | 2.2M |
| BXSL |  | Finance | 24.19 | +0.02% | +0.43 | -4.21 | -2.03 | 106% | 1.7M |
| CNP | 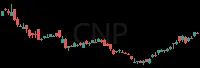 | Utilities | 39.78 | 0.00% | +0.10 | -1.04 | 4.20 | 107% | 6.8M |
| ORLY |  | Consumer Dis | 88.50 | +0.03% | +2.47 | 6.96 | -1.17 | 108% | 5.9M |
| IMO | 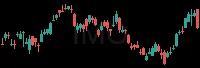 | Energy | 129.59 | +0.01% | +0.66 | -2.66 | 0.84 | 109% | 773.7K |
| DUK | 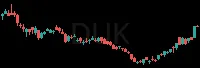 | Utilities | 119.04 | -0.01% | -0.60 | 1.41 | 3.40 | 111% | 4.8M |
| MAIN | 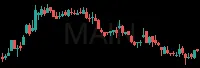 | Finance | 54.50 | +0.01% | +0.73 | 3.26 | -2.44 | 112% | 564.7K |
| REGN | 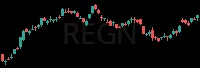 | Health Care | 796.34 | +0.06% | +43.22 | -5.48 | -2.70 | 112% | 798.9K |
| T | 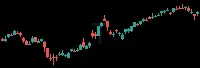 | Telecommunic | 23.49 | +0.02% | +0.44 | 2.04 | -3.50 | 113% | 45.2M |
| COLD | 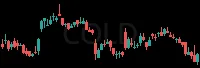 | Real Estate | 13.92 | +0.01% | +0.11 | 2.82 | -2.28 | 114% | 4.0M |
| OSBC | 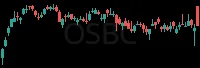 | Finance | 24.85 | 0.00% | +0.05 | 1.16 | -1.43 | 115% | 546.9K |
| CCI | 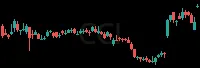 | Real Estate | 78.88 | -0.01% | -0.50 | -11.28 | 3.99 | 115% | 4.2M |
| AXTA |  | Consumer Dis | 33.73 | +0.02% | +0.55 | 0.26 | 0.03 | 115% | 2.5M |
| STRC | 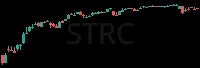 | Technology | 99.32 | -0.01% | -0.58 | -2.86 | 2.59 | 116% | 1.8M |
| REXR | 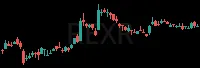 | Real Estate | 37.00 | -0.02% | -0.84 | -1.39 | -0.68 | 117% | 4.0M |
| SUZ | 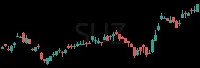 | Basic Materi | 8.35 | -0.02% | -0.21 | -2.08 | -0.69 | 118% | 4.5M |
| TIGO | 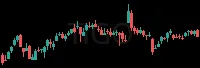 | Telecommunic | 82.07 | +0.02% | +1.73 | 4.67 | -3.14 | 119% | 1.5M |
| NFG | 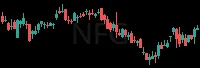 | Utilities | 78.38 | -0.03% | -2.71 | 0.88 | 0.28 | 119% | 1.3M |
| ACI | 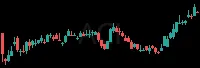 | Consumer Sta | 13.02 | 0.00% | -0.06 | 3.93 | 2.79 | 119% | 9.1M |
| VTR | 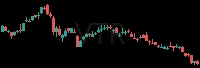 | Real Estate | 84.59 | 0.00% | +0.28 | -1.60 | -2.12 | 120% | 4.2M |
| CF | 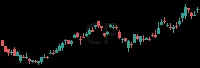 | Industrials | 119.80 | 0.00% | +0.34 | 16.94 | 0.41 | 121% | 3.2M |
| HLN | 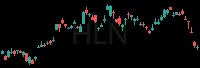 | Consumer Dis | 9.95 | +0.05% | +0.51 | 3.02 | -0.09 | 121% | 18.3M |
| WEC | 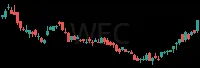 | Utilities | 105.97 | -0.01% | -0.78 | 0.53 | 2.48 | 122% | 3.2M |
| FMX | 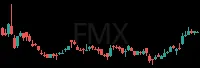 | Consumer Sta | 120.99 | 0.00% | -0.19 | -0.36 | -0.51 | 124% | 976.7K |
RS = relative strength vs SPY, in ATRs (1 hour / 2 weeks); green leads the market, red lags. RVOL = today's volume vs average. Prices are 15-minute delayed.
New here? How to trade these scans · More Pullbacks+Levels scans: Dead Cat Bounce · Bearish Pullback - Short · VWAP Pullbacks - Short · Bear Flag - Short · Near Day Low · Open Air - Short · Near Open Air - Short