All scans · Short
In Play - Short
Open live →ZenBot is a free real-time scanner that surfaces the stocks in play — heavy volume, leading their sector, moving before the crowd. This is one of its built-in scans.

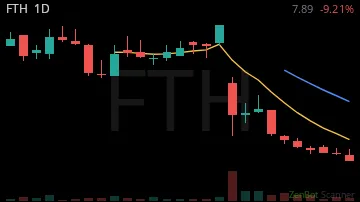

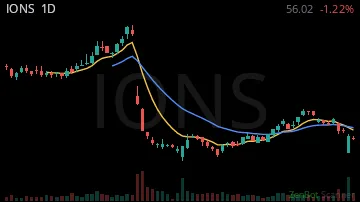
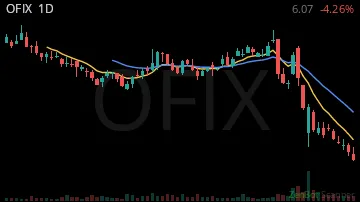
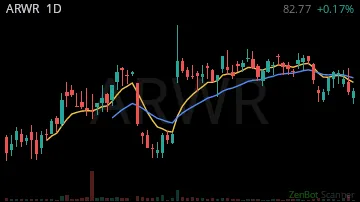
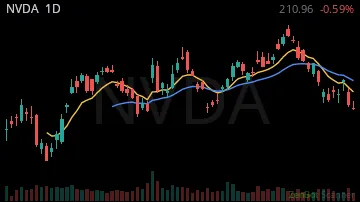


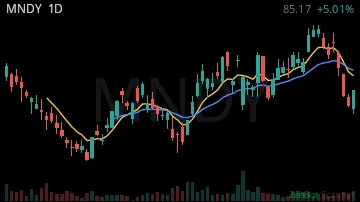
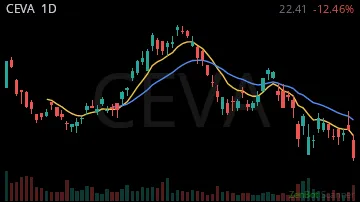

| Symbol | Chart | Sector | Last | Chg % | Chg $ | RS 1H | RS 2W | RVOL | Vol |
|---|---|---|---|---|---|---|---|---|---|
| ABEO |  | Health Care | 2.63 | -0.37% | -1.54 | 0.36 | 1.83 | 1,112% | 13.5M |
| FTH | 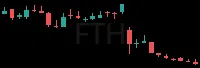 | Health Care | 12.41 | -0.44% | -9.64 | 0.05 | 4.08 | 1,052% | 4.0M |
| MPAA |  | Consumer Dis | 7.74 | -0.26% | -2.78 | 0.89 | 4.80 | 572% | 591.9K |
| IONS |  | Health Care | 30.99 | -0.21% | -8.43 | -3.43 | 0.53 | 562% | 19.7M |
| OFIX | 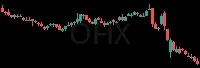 | Health Care | 7.90 | 0.00% | +0.03 | 2.47 | 0.38 | 497% | 2.7M |
| ARWR |  | Health Care | 49.60 | -0.15% | -8.56 | -13.51 | 3.04 | 418% | 8.1M |
| NVDA | 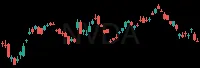 | Technology | 179.80 | -0.04% | -6.84 | 2.40 | -1.03 | 391% | 459.8M |
| IBRX | 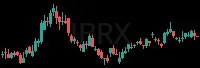 | Health Care | 7.12 | -0.18% | -1.52 | -0.83 | 3.32 | 363% | 44.8M |
| LFMD |  | Health Care | 2.18 | -0.08% | -0.19 | 12.40 | 4.82 | 292% | 2.2M |
| MNDY | 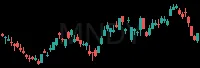 | Technology | 80.22 | -0.09% | -7.71 | -4.52 | 1.23 | 283% | 3.1M |
| CEVA | 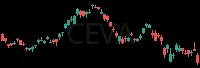 | Technology | 24.90 | -0.08% | -2.20 | 2.59 | 2.09 | 212% | 1.2M |
| TNXP |  | Health Care | 4.68 | -0.01% | -0.06 | 8.71 | 1.27 | 202% | 1.4M |
RS = relative strength vs SPY, in ATRs (1 hour / 2 weeks); green leads the market, red lags. RVOL = today's volume vs average. Prices are 15-minute delayed.
New here? How to trade these scans · More Top Scans scans: Trending Now - Short · Opening Range - Short · Top Shorts · Has Trade Signal - Short · Ready to Trend - Short