All scans · Short
After Earnings - Short
Open live →ZenBot is a free real-time scanner that surfaces the stocks in play — heavy volume, leading their sector, moving before the crowd. This is one of its built-in scans.


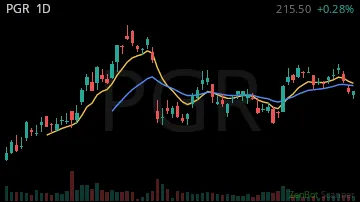

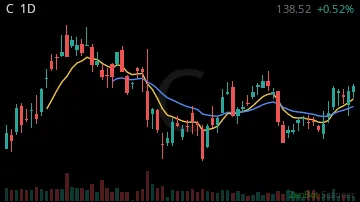

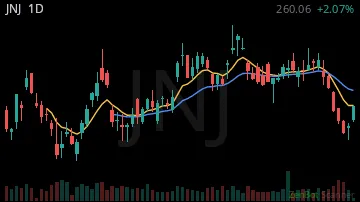
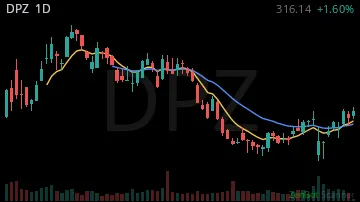

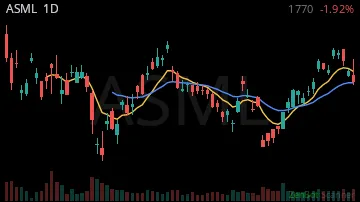
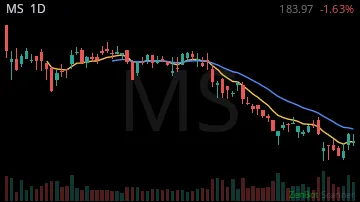
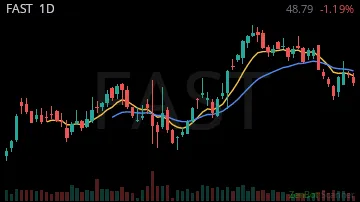
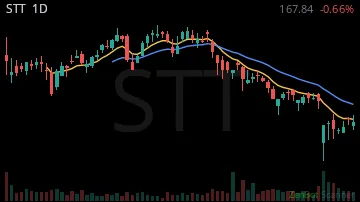
| Symbol | Chart | Sector | Last | Chg % | Chg $ | RS 1H | RS 2W | RVOL | Vol |
|---|---|---|---|---|---|---|---|---|---|
| NUCL |  | Basic Materi | 5.20 | -0.05% | -0.27 | -1.15 | -3.38 | 76% | 225.9K |
| FBK |  | Finance | 51.48 | +0.01% | +0.76 | 2.63 | -2.97 | 96% | 815.8K |
| PGR |  | Finance | 213.75 | -0.04% | -9.13 | -5.36 | 3.18 | 99% | 3.5M |
| SOTK |  | Technology | 6.11 | -0.14% | -1.02 | -1.53 | 2.28 | 116% | 104.7K |
| C |  | Finance | 123.20 | +0.01% | +0.93 | 0.57 | -3.42 | 122% | 11.4M |
| BAC | 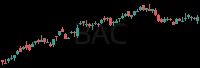 | Finance | 51.75 | +0.01% | +0.36 | 0.29 | -3.86 | 129% | 45.9M |
| JNJ |  | Health Care | 253.52 | +0.02% | +4.91 | 3.59 | -4.88 | 136% | 9.3M |
| DPZ | 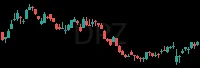 | Consumer Dis | 303.80 | +0.03% | +7.91 | 10.85 | -0.26 | 137% | 1.1M |
| AZZ |  | Industrials | 130.06 | -0.06% | -7.60 | 0.96 | 0.07 | 138% | 329.5K |
| ASML |  | Technology | 1660.57 | +0.01% | +10.57 | 2.00 | -2.92 | 150% | 2.0M |
| MS | 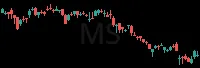 | Finance | 182.25 | -0.02% | -4.39 | -1.60 | -3.48 | 185% | 9.1M |
| FAST |  | Consumer Dis | 50.38 | -0.02% | -1.05 | -1.95 | -0.08 | 189% | 13.5M |
| STT | 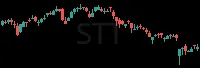 | Finance | 166.90 | -0.04% | -7.20 | 11.03 | -3.31 | 230% | 4.2M |
RS = relative strength vs SPY, in ATRs (1 hour / 2 weeks); green leads the market, red lags. RVOL = today's volume vs average. Prices are 15-minute delayed.
New here? How to trade these scans · More News+Earnings scans: Down On News · Earnings Soon - Short