All scans · Short
Earnings Losers
Open live →ZenBot is a free real-time scanner that surfaces the stocks in play — heavy volume, leading their sector, moving before the crowd. This is one of its built-in scans.
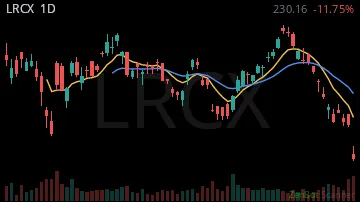
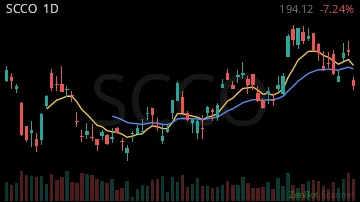
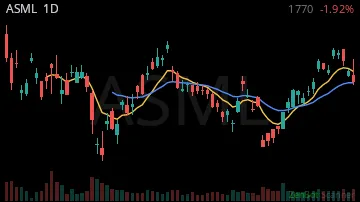
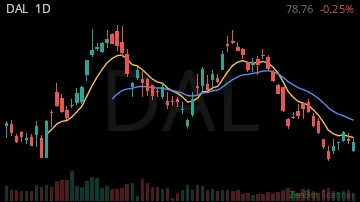
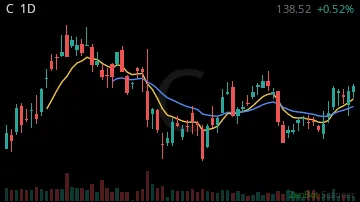


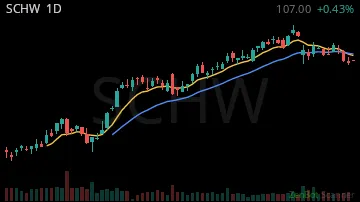
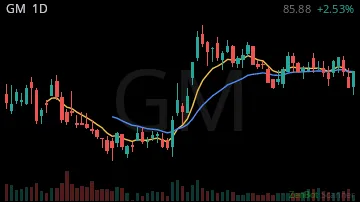
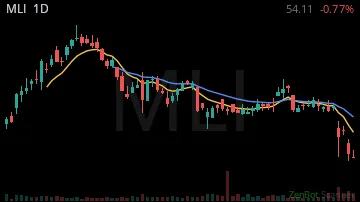
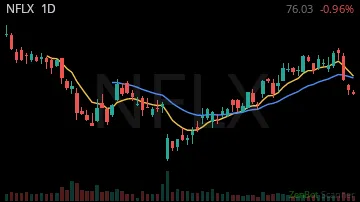
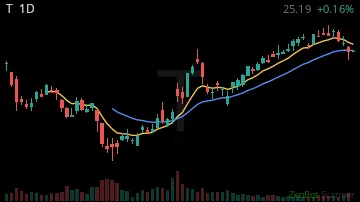
| Symbol | Chart | Sector | Last | Chg % | Chg $ | RS 1H | RS 2W | RVOL | Vol |
|---|---|---|---|---|---|---|---|---|---|
| LRCX |  | Technology | 239.79 | -0.08% | -21.02 | 3.01 | -5.72 | 618% | 232.5K |
| SCCO |  | Basic Materi | 191.00 | -0.04% | -7.07 | -6.79 | -0.71 | 100% | 1.5K |
| ASML |  | Technology | 1619.59 | -0.03% | -57.10 | -0.72 | -3.14 | 93% | 26.3K |
| DAL |  | Industrials | 76.10 | -0.02% | -1.57 | -0.17 | -1.62 | 68% | 7.1K |
| C |  | Finance | 122.50 | -0.01% | -1.35 | -2.96 | -1.15 | 100% | 4.1K |
| GE |  | Technology | 293.91 | -0.01% | -1.97 | 0.82 | -1.08 | 204% | 5.5K |
| BAC | 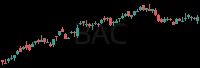 | Finance | 50.45 | -0.01% | -0.33 | -3.99 | -2.23 | 80% | 30.5K |
| SCHW | 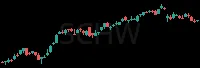 | Finance | 91.24 | 0.00% | -0.40 | -1.00 | -2.63 | 100% | 932 |
| GM | 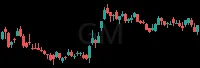 | Consumer Dis | 75.80 | 0.00% | -0.31 | 11.32 | -1.59 | 349% | 8.8K |
| MLI | 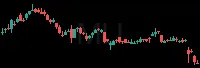 | Industrials | 57.54 | 0.00% | 0.00 | -0.15 | -2.73 | 144% | 0 |
| NFLX |  | Telecommunic | 65.15 | 0.00% | +0.11 | 0.33 | -0.99 | 213% | 388.1K |
| T |  | Telecommunic | 22.05 | +0.01% | +0.14 | -1.35 | -2.74 | 350% | 108.5K |
RS = relative strength vs SPY, in ATRs (1 hour / 2 weeks); green leads the market, red lags. RVOL = today's volume vs average. Prices are 15-minute delayed.
New here? How to trade these scans · More News+Earnings scans: Down On News · After Earnings - Short · Earnings Soon - Short