All scans · Long
Earnings Winners
Open live →ZenBot is a free real-time scanner that surfaces the stocks in play — heavy volume, leading their sector, moving before the crowd. This is one of its built-in scans.
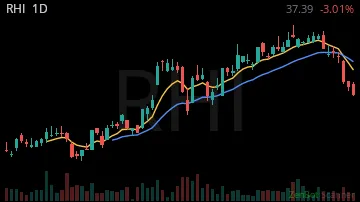
RHI41.00 +0.18%
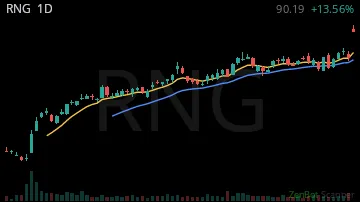
RNG91.16 +0.11%
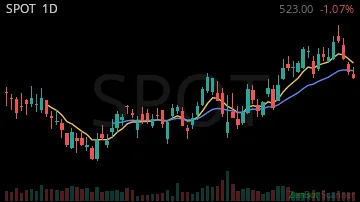
SPOT580.00 +0.10%
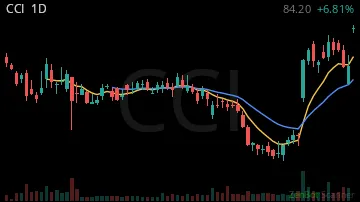
CCI86.00 +0.09%
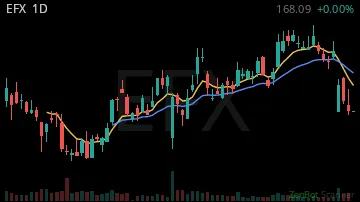
EFX187.14 +0.07%
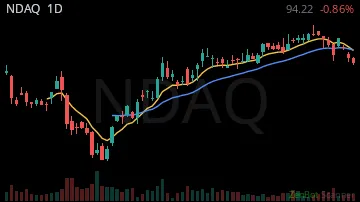
NDAQ102.32 +0.06%
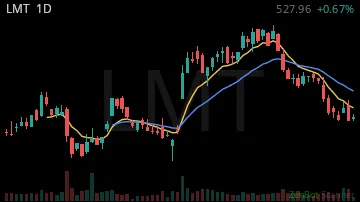
LMT586.00 +0.06%
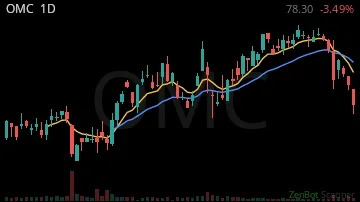
OMC84.75 +0.05%
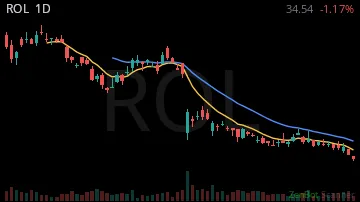
ROL35.20 +0.05%
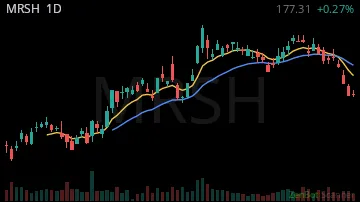
MRSH199.94 +0.05%
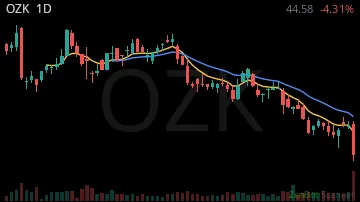
OZK49.67 +0.03%
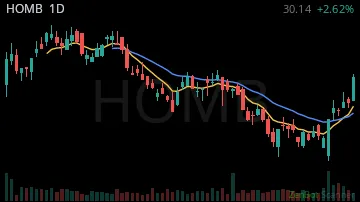
HOMB30.15 +0.03%
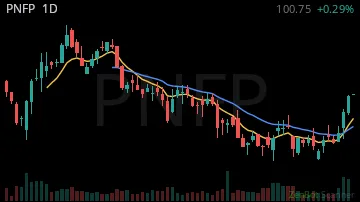
PNFP100.75 +0.03%
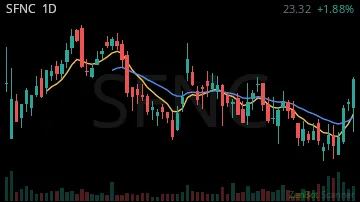
SFNC23.32 +0.02%
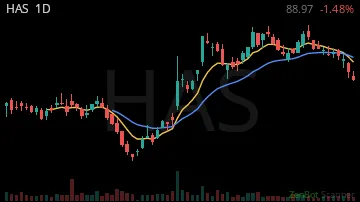
HAS115.26 +0.01%
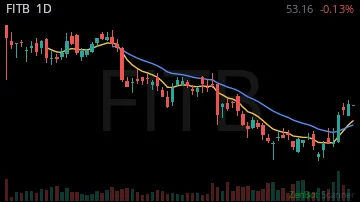
FITB53.24 +0.01%
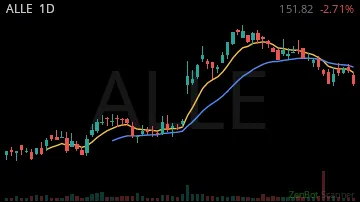
ALLE177.80 +0.01%
DOW31.99 +0.01%

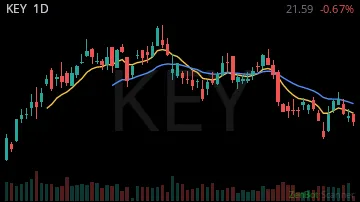
KEY21.14 +0.01%
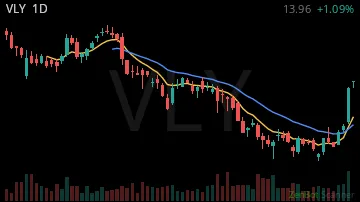
VLY13.85 0.00%
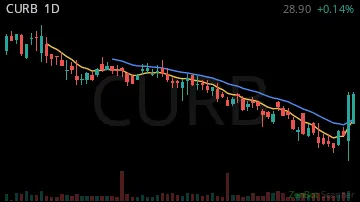
CURB28.90 0.00%
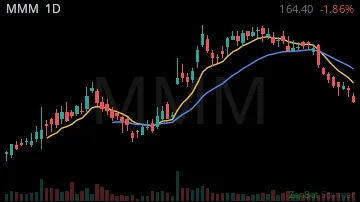
MMM174.84 0.00%
AMX24.98 0.00%

AUB40.10 0.00%

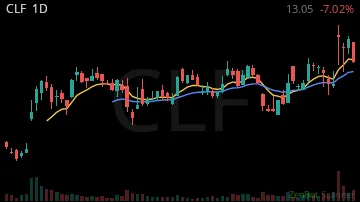
CLF13.02 0.00%
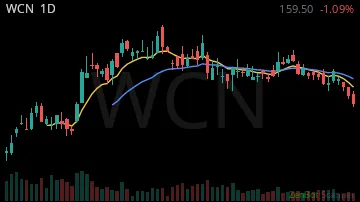
WCN184.19 0.00%
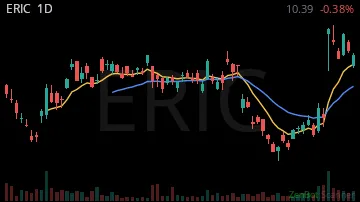
ERIC10.37 -0.01%
UNH422.37 -0.01%

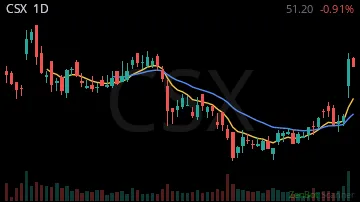
CSX51.20 -0.01%
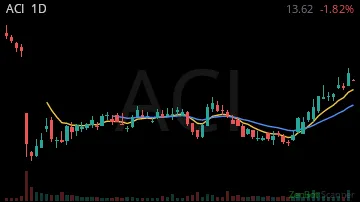
ACI13.67 -0.01%
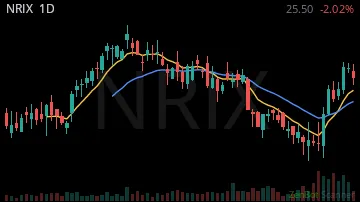
NRIX25.30 -0.03%
| Symbol | Chart | Sector | Last | Chg % | Chg $ | RS 1H | RS 2W | RVOL | Vol |
|---|---|---|---|---|---|---|---|---|---|
| RHI |  | Consumer Dis | 41.00 | +0.18% | +6.36 | -4.77 | 0.48 | 408% | 3.0K |
| RNG | 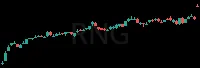 | Technology | 91.16 | +0.11% | +8.74 | -1.94 | 1.15 | 2,007% | 22.3K |
| SPOT | 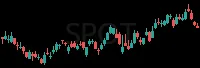 | Consumer Dis | 580.00 | +0.10% | +54.66 | 1.28 | 2.60 | 81% | 5.7K |
| CCI | 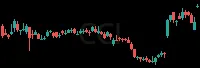 | Real Estate | 86.00 | +0.09% | +7.17 | 4.07 | 5.45 | 1,416% | 42.1K |
| EFX | 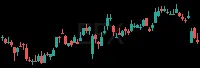 | Finance | 187.14 | +0.07% | +11.57 | -4.39 | 6.28 | 166% | 190 |
| NDAQ | 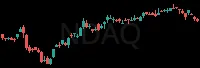 | Finance | 102.32 | +0.06% | +6.20 | -12.07 | 2.34 | 76% | 2.9K |
| LMT |  | Industrials | 586.00 | +0.06% | +34.49 | -4.56 | 4.11 | 126% | 12.6K |
| OMC | 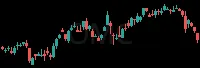 | Telecommunic | 84.75 | +0.05% | +4.25 | 15.33 | 3.14 | 156% | 778 |
| ROL |  | Consumer Dis | 35.20 | +0.05% | +1.75 | 2.82 | 4.50 | 100% | 611 |
| MRSH | 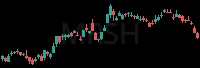 | Finance | 199.94 | +0.05% | +9.38 | 15.33 | 5.20 | 123% | 973 |
| OZK | 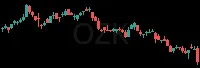 | Finance | 49.67 | +0.03% | +1.58 | -4.02 | 1.48 | 143% | 162 |
| HOMB | 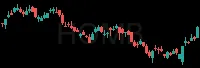 | Finance | 30.15 | +0.03% | +0.78 | -4.44 | 1.85 | 66% | 0 |
| PNFP | 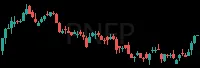 | Finance | 100.75 | +0.03% | +2.54 | 9.07 | 1.18 | 96% | 400 |
| SFNC | 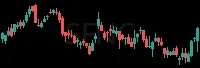 | Finance | 23.32 | +0.02% | +0.43 | -3.14 | 0.66 | 95% | 0 |
| HAS | 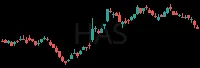 | Consumer Dis | 115.26 | +0.01% | +1.26 | -11.30 | 6.69 | 189% | 429 |
| FITB | 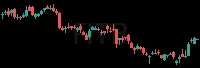 | Finance | 53.24 | +0.01% | +0.43 | 11.42 | 2.10 | 97% | 0 |
| ALLE |  | Consumer Dis | 177.80 | +0.01% | +1.28 | 14.25 | 6.55 | 2,615% | 1.4K |
| DOW | 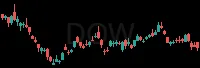 | Industrials | 31.99 | +0.01% | +0.18 | 10.92 | 6.49 | 58% | 10.3K |
| KEY | 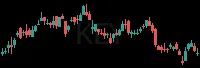 | Finance | 21.14 | +0.01% | +0.11 | -7.73 | 2.26 | 181% | 1.0K |
| VLY | 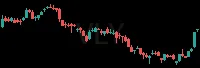 | Finance | 13.85 | 0.00% | +0.04 | 0.99 | 5.87 | 5,124% | 31.8K |
| CURB | 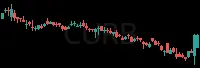 | Finance | 28.90 | 0.00% | +0.04 | -2.14 | 3.23 | 100% | 4.0K |
| MMM | 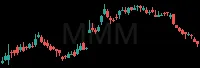 | Health Care | 174.84 | 0.00% | +0.10 | -12.03 | 3.01 | 17% | 1.3K |
| AMX | 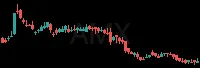 | Telecommunic | 24.98 | 0.00% | 0.00 | 0.94 | 6.33 | 137% | 0 |
| AUB | 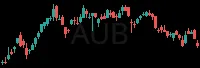 | Finance | 40.10 | 0.00% | 0.00 | -1.35 | 4.49 | 94% | 0 |
| CLF | 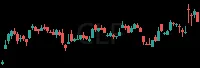 | Basic Materi | 13.02 | 0.00% | -0.03 | -0.97 | 3.04 | 50% | 19.6K |
| WCN | 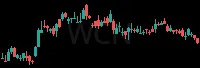 | Utilities | 184.19 | 0.00% | -0.69 | 13.87 | 8.48 | 193% | 500 |
| ERIC | 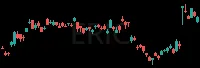 | Technology | 10.37 | -0.01% | -0.06 | 1.38 | 4.44 | 62% | 132.3K |
| UNH |  | Health Care | 422.37 | -0.01% | -2.62 | 1.14 | 5.76 | 15% | 10.8K |
| CSX | 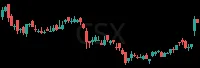 | Industrials | 51.20 | -0.01% | -0.47 | 1.42 | 6.56 | 249% | 5.0K |
| ACI | 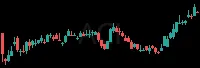 | Consumer Sta | 13.67 | -0.01% | -0.20 | 13.49 | 7.22 | 224% | 3.8K |
| NRIX | 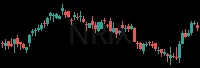 | Health Care | 25.30 | -0.03% | -0.72 | -10.38 | 2.76 | 10% | 191 |
RS = relative strength vs SPY, in ATRs (1 hour / 2 weeks); green leads the market, red lags. RVOL = today's volume vs average. Prices are 15-minute delayed.
New here? How to trade these scans · More News+Earnings scans: Up On News · After Earnings - Long · Earnings Soon - Long