All scans · Short
Gap Fade Scanner
Open live →ZenBot is a free real-time scanner that surfaces the stocks in play — heavy volume, leading their sector, moving before the crowd. This is one of its built-in scans.
WM220.00 +0.02%
UL64.65 +0.01%
PG157.00 +0.03%
PM199.90 0.00%
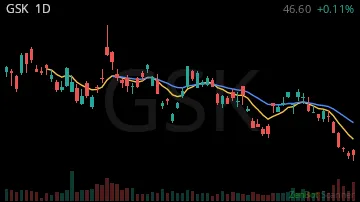
GSK49.02 +0.06%
LLY1252.10 +0.07%

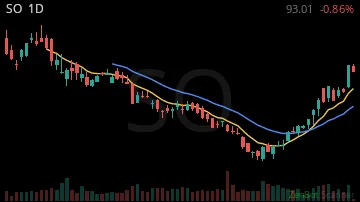
SO89.18 +0.01%
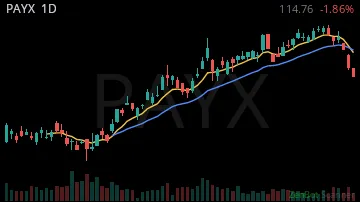
PAYX110.50 +0.04%
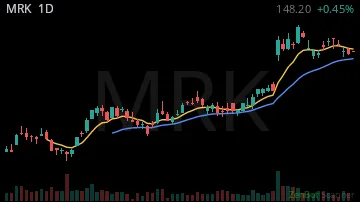
MRK145.40 +0.02%
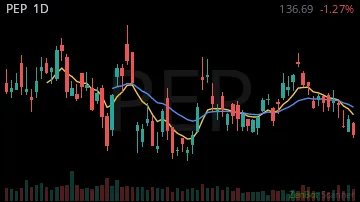
PEP128.51 +0.01%
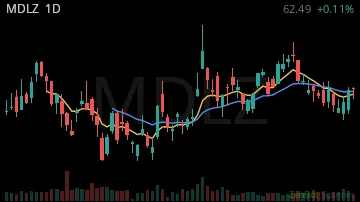
MDLZ63.03 +0.02%
AZN166.69 +0.03%

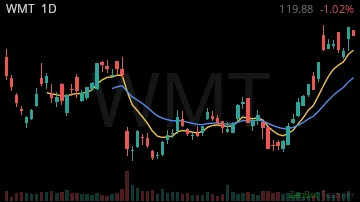
WMT117.76 +0.01%
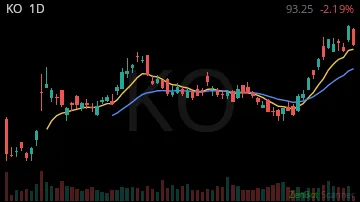
KO91.95 +0.02%
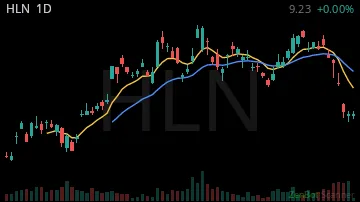
HLN9.85 +0.04%
PRGO16.16 +0.05%

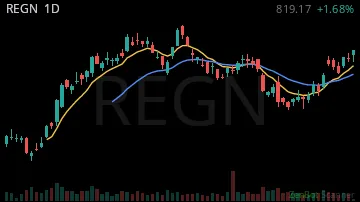
REGN796.34 +0.06%
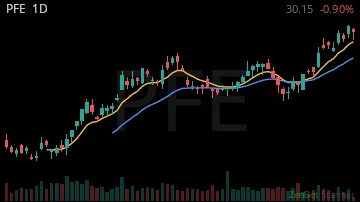
PFE29.36 +0.03%
PHAT7.45 +0.06%

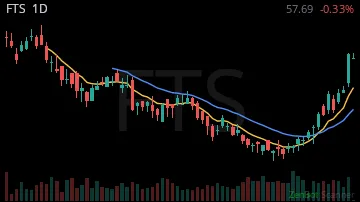
FTS54.66 +0.01%
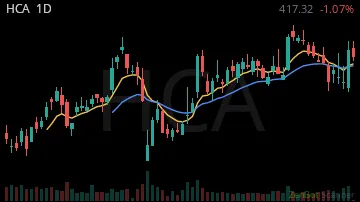
HCA468.00 +0.02%
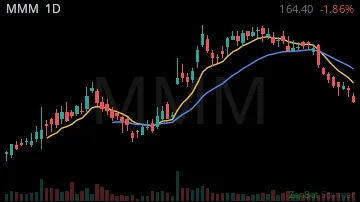
MMM164.59 +0.01%
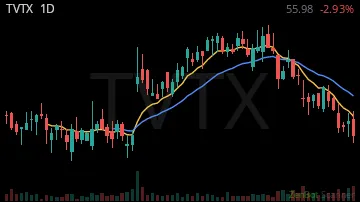
TVTX52.79 -0.01%
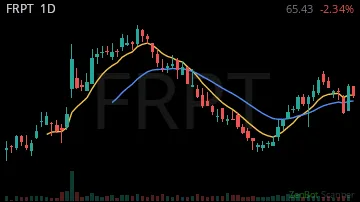
FRPT67.65 +0.02%
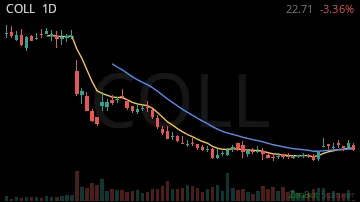
COLL23.06 +0.02%
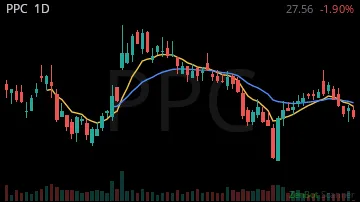
PPC28.89 0.00%
| Symbol | Chart | Sector | Last | Chg % | Chg $ | RS 1H | RS 2W | RVOL | Vol |
|---|---|---|---|---|---|---|---|---|---|
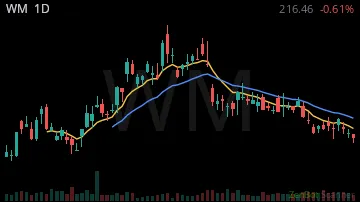
| WM |  | Utilities | 220.00 | +0.02% | +4.25 | -5.13 | 2.10 | 248% | 5.2M |
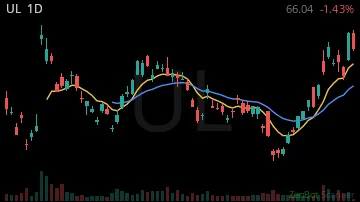
| UL |  | Consumer Dis | 64.65 | +0.01% | +0.79 | 3.63 | 0.70 | 244% | 7.8M |
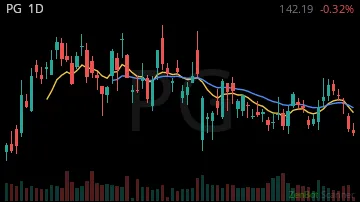
| PG |  | Consumer Dis | 157.00 | +0.03% | +3.96 | -16.67 | 1.61 | 191% | 16.4M |
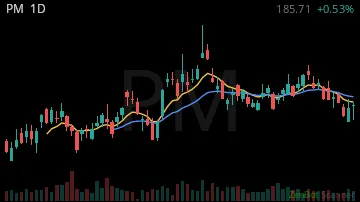
| PM |  | Consumer Sta | 199.90 | 0.00% | +0.61 | 2.72 | 0.96 | 180% | 8.0M |
| GSK |  | Health Care | 49.02 | +0.06% | +2.75 | 0.00 | -4.72 | 162% | 6.1M |
| LLY |  | Health Care | 1252.10 | +0.07% | +85.59 | 6.14 | -1.63 | 152% | 3.8M |
| SO |  | Utilities | 89.18 | +0.01% | +1.07 | 1.05 | 2.98 | 145% | 8.6M |
| PAYX |  | Industrials | 110.50 | +0.04% | +4.25 | -4.83 | 1.27 | 142% | 4.0M |
| MRK |  | Health Care | 145.40 | +0.02% | +3.42 | 1.23 | -3.15 | 137% | 13.9M |
| PEP |  | Consumer Sta | 128.51 | +0.01% | +1.21 | 1.98 | -1.65 | 137% | 11.7M |
| MDLZ |  | Consumer Sta | 63.03 | +0.02% | +1.53 | -1.06 | 0.01 | 135% | 10.3M |
| AZN |  | Health Care | 166.69 | +0.03% | +4.66 | 0.87 | -1.86 | 134% | 4.4M |
| WMT |  | Consumer Sta | 117.76 | +0.01% | +1.60 | -1.31 | 2.50 | 134% | 32.1M |
| KO |  | Consumer Sta | 91.95 | +0.02% | +1.84 | 0.13 | 0.77 | 130% | 19.7M |
| HLN | 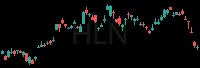 | Consumer Dis | 9.85 | +0.04% | +0.41 | -10.40 | -0.09 | 125% | 18.3M |
| PRGO |  | Health Care | 16.16 | +0.05% | +0.79 | -7.72 | -1.18 | 118% | 3.3M |
| REGN |  | Health Care | 796.34 | +0.06% | +43.22 | -5.48 | -2.70 | 112% | 798.9K |
| PFE |  | Health Care | 29.36 | +0.03% | +0.99 | 0.26 | -1.68 | 96% | 32.9M |
| PHAT | 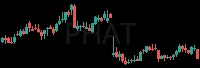 | Health Care | 7.45 | +0.06% | +0.45 | -2.60 | -2.02 | 92% | 1.2M |
| FTS | 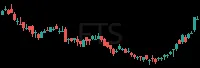 | Utilities | 54.66 | +0.01% | +0.63 | -5.53 | 0.39 | 88% | 903.5K |
| HCA |  | Health Care | 468.00 | +0.02% | +7.25 | -2.06 | 1.24 | 87% | 1.1M |
| MMM | 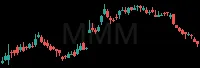 | Health Care | 164.59 | +0.01% | +1.82 | -1.30 | -3.10 | 86% | 3.6M |
| TVTX | 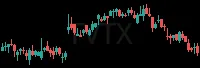 | Health Care | 52.79 | -0.01% | -0.48 | -1.09 | -4.24 | 79% | 2.0M |
| FRPT | 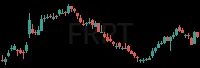 | Consumer Sta | 67.65 | +0.02% | +1.49 | 0.00 | 2.40 | 72% | 886.7K |
| COLL | 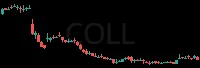 | Health Care | 23.06 | +0.02% | +0.55 | -2.84 | -0.81 | 69% | 1.0M |
| PPC | 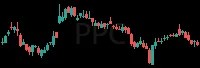 | Consumer Sta | 28.89 | 0.00% | +0.10 | -3.06 | -0.18 | 48% | 994.4K |
RS = relative strength vs SPY, in ATRs (1 hour / 2 weeks); green leads the market, red lags. RVOL = today's volume vs average. Prices are 15-minute delayed.
New here? How to trade these scans · More Gaps scans: Falling Into Gap · Old Gap Fill - Short