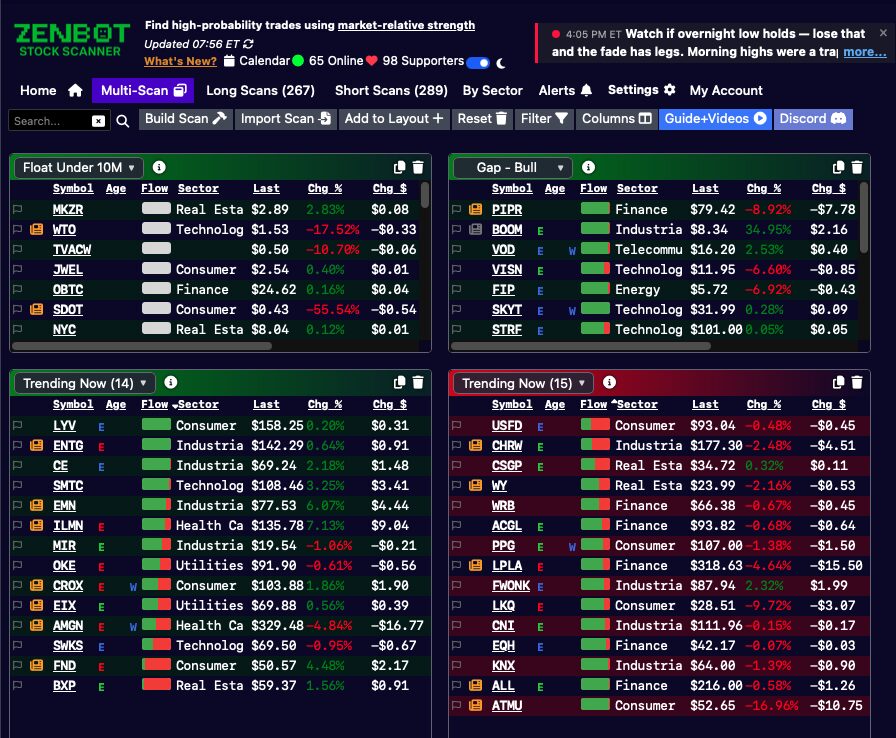
Real-time stock scanner
Trade with the smart money — not against it.ZenBot scans the entire market in real time to surface stocks actually in play — heavy volume, leading their sector, breaking out before the crowd notices. Skip the noise. Get clear long and short setups, options price targets, and the catalysts moving them, all in one place. Whether you day trade, swing trade, or hunt asymmetric options plays, start every session knowing exactly where the action is. Loading ZenBot Scanner91
Built-in scans
186+
Filters & indicators
1m
Live Data Refresh
7700+
Stocks Watched
1000+
Trusted by traders
01 / Signal & scans
Built around relative strength, sharpened by predictive signals.★ Core philosophy
Trade what's strong against what's weakRelative strength is the heartbeat of ZenBot. Every scan compares each ticker's move against SPY and against its sector — continuously, throughout the session — so you're always looking at the leaders moving with institutional interest, not random gappers. If SPY pulls back, your longs have a cushion. If SPY rips, your shorts still bleed. It's the same approach taught in r/RealDayTrading, hard-coded into the scanner.
RS vs SPY
RS vs sector
Relative Volume
Leaders & laggards
Continuous calc
▲ New — Spring 2026
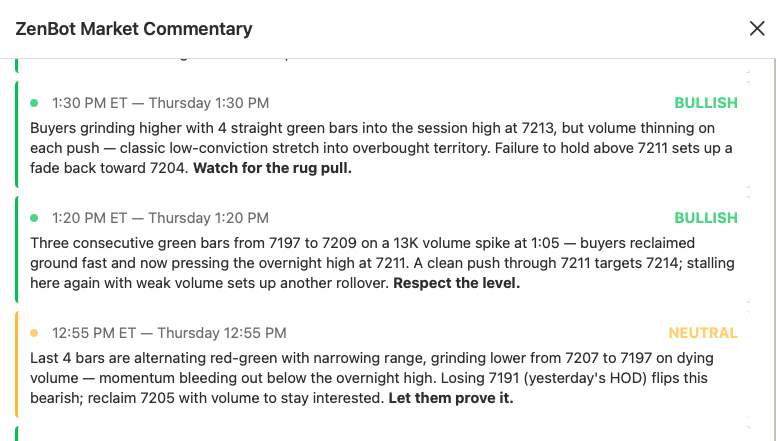
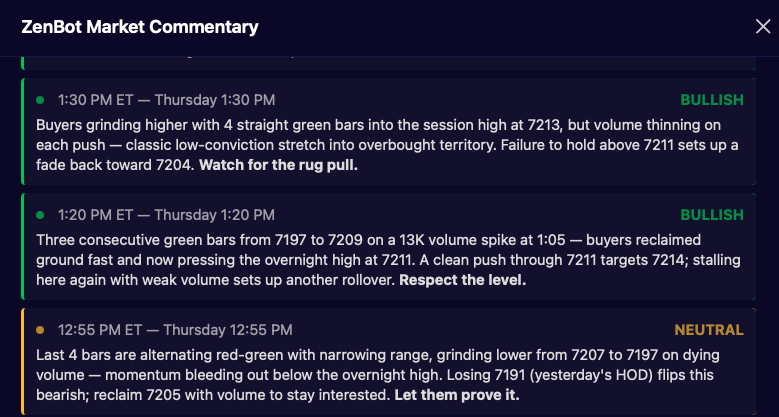
Live market commentaryReal-time market commentary written by Zen for day traders. The bot watches the tape and posts what's moving, where the flow is going, and which catalysts are firing — so you have context, not just tickers.
Real-time
Day-trader focus
Catalysts
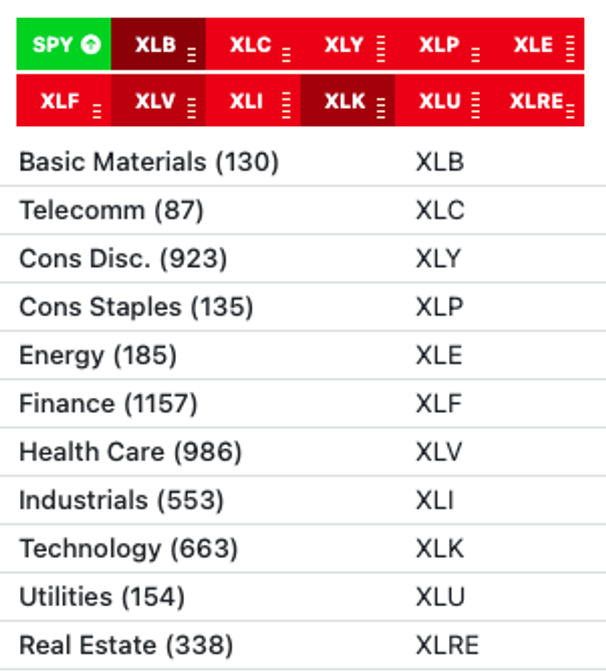
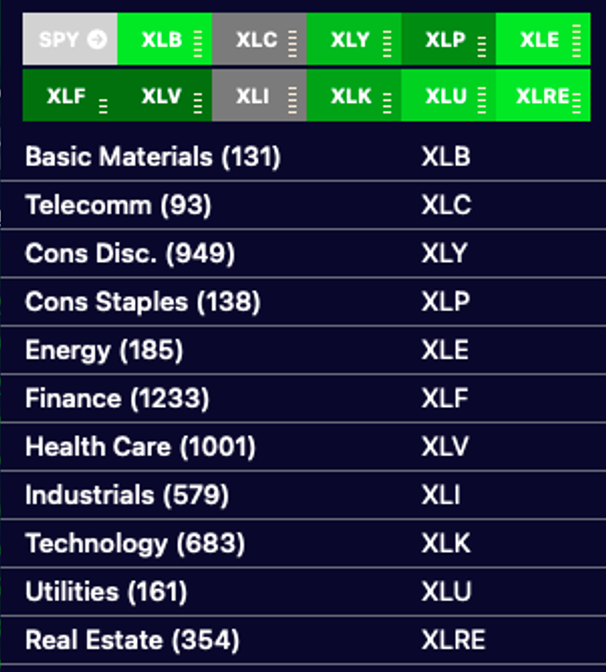
Sector flow
Trade the strongest sectorsZenBot ranks all 11 sectors live by relative strength, relative volume, and momentum — so you spot rotation as it happens. Long the strong, short the weak, and filter any scan to leaders inside the leading sectors.
Sector RS rankings
Sector RVol
Live rankings
Rotation tracking
◎ Open source
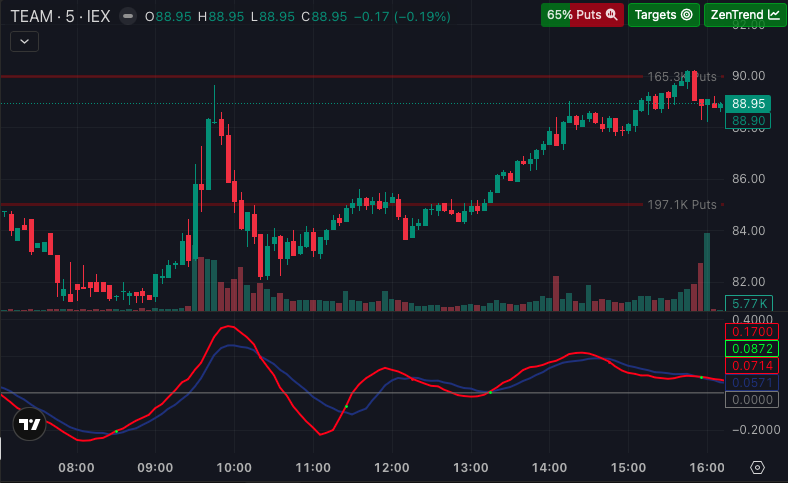
ZenTrend predictive indicatorA custom predictive trend indicator that plots the cycles price makes between the top and bottom of a channel. Often a leading signal of where price wants to go next — built from years of live trading and now open source. 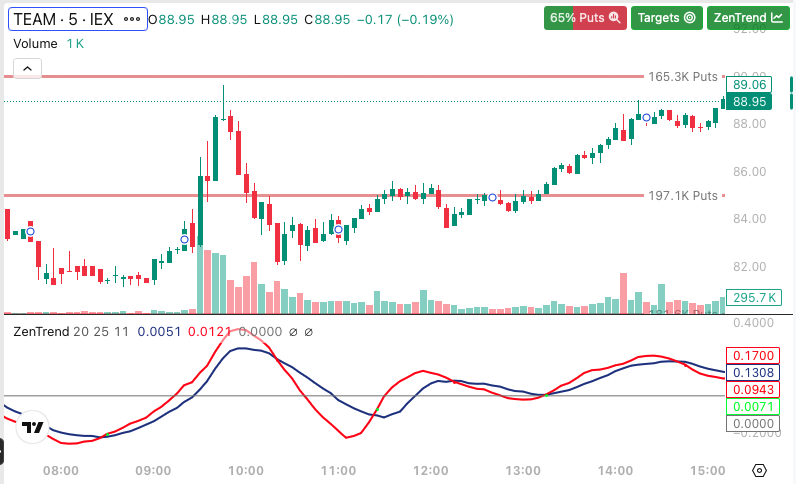
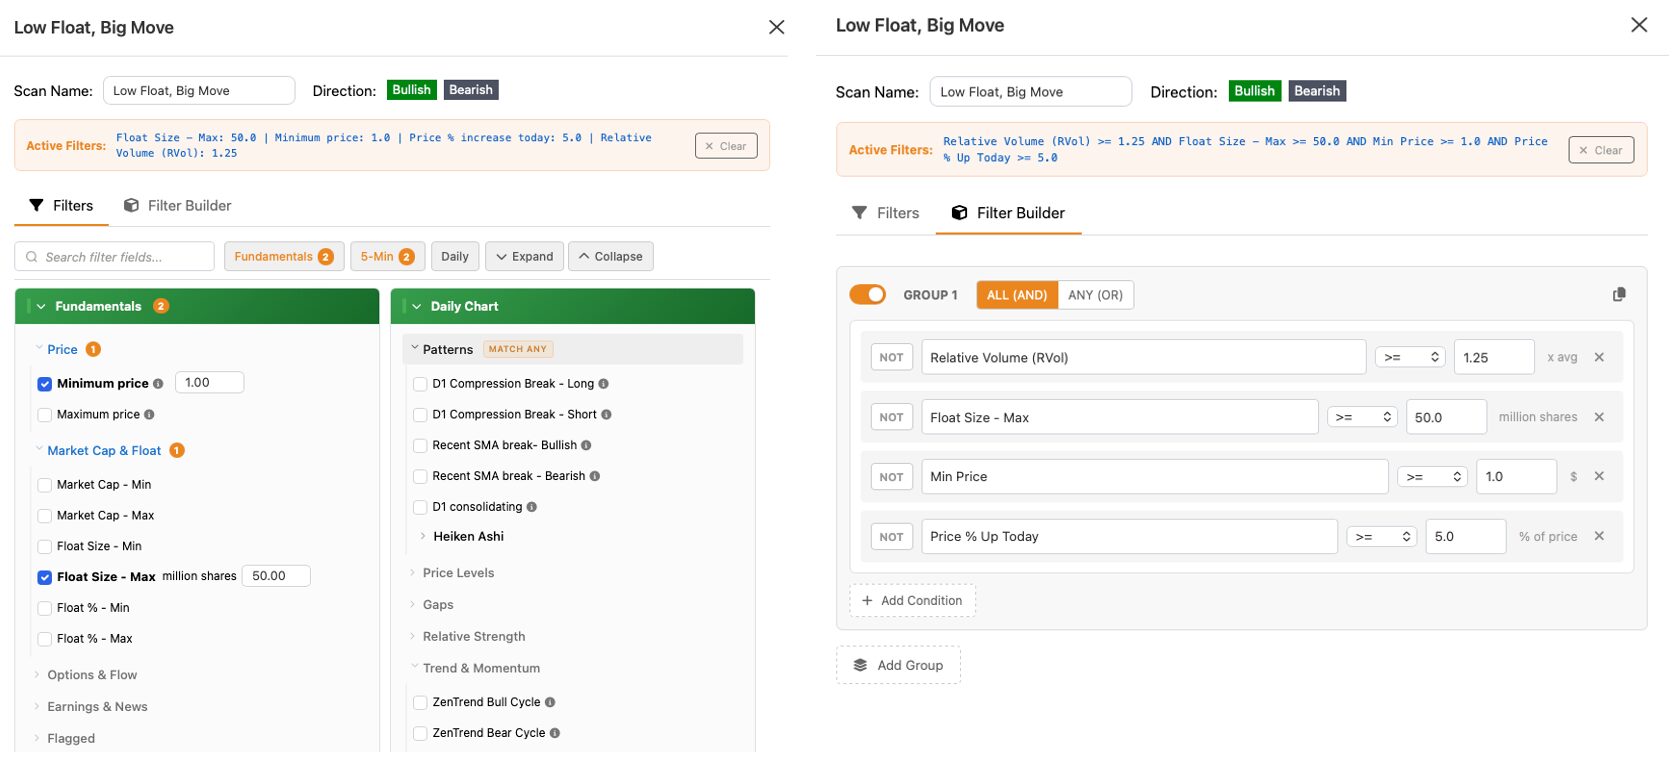
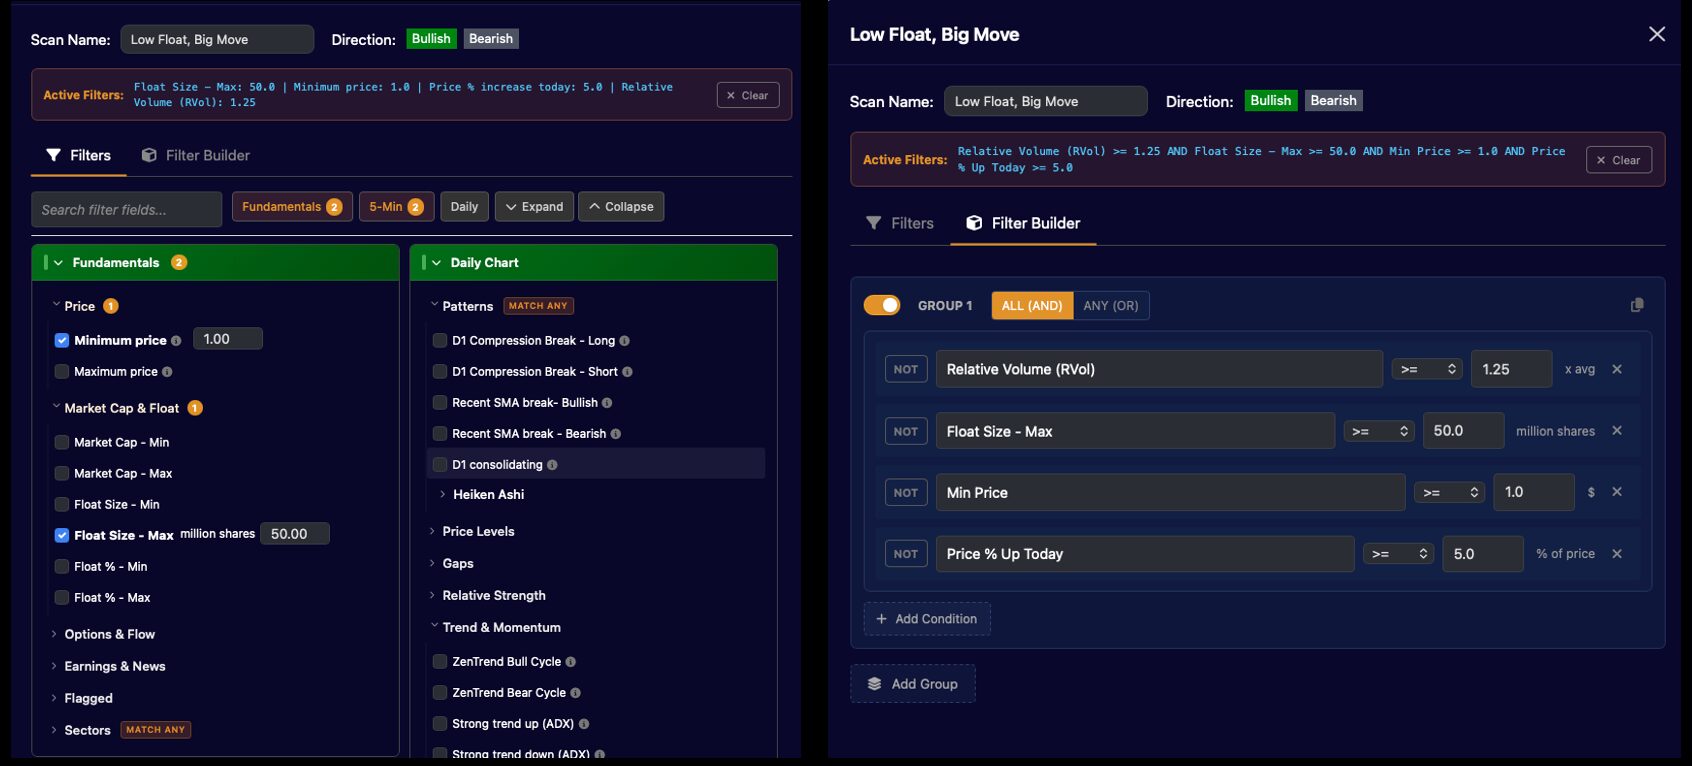
◆ Filter Builder · 186 filters
Build exactly the scan you wantThe Filter Builder lets you combine 186 filters into groups of conditions — mix bullish and bearish criteria, layer technicals with options flow, and save it as a custom scan. April 2026 added MACD, Heiken Ashi reversal/continuation, RSI, TTM Squeeze, AVWAP (earnings, quarter, year, 52-week), ADR and more.
Relative Strength
Relative Volume
Call/Put DEX
ZenTrend cycle
TTM Squeeze
MACD & RSI
Heiken Ashi
AVWAP — earnings/year
VWAP slope
EMA Power Angle
Float & Market Cap
Earnings & News
+ 170 more
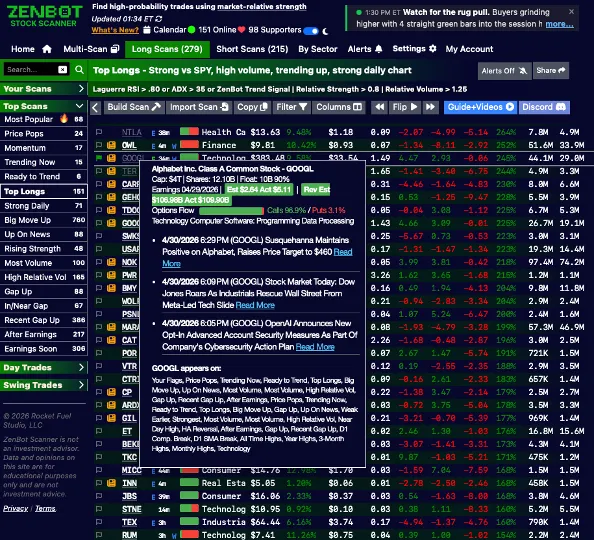
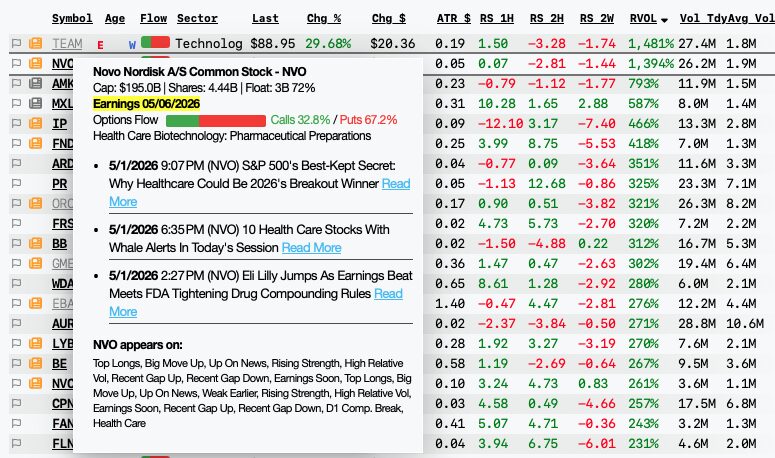
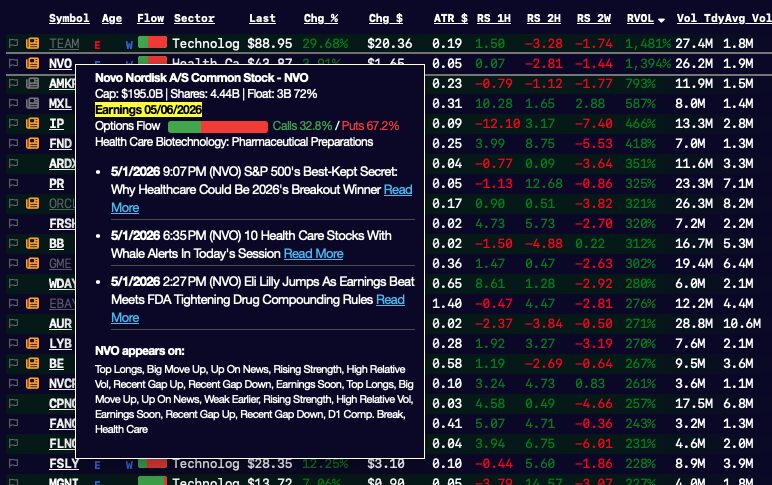
Earnings & news, on every tickerZenBot tags why a stock is moving. News-of-the-day flags appear next to every ticker, with one-click access to the headline. Earnings are flagged so you never get blindsided by a report. Filter scans by "has news today" or "earnings within N days" to find catalyst-driven setups.
News today flag
Earnings recently / soon
Catalyst filtering
Headline preview
02 / Real-time edge
See the market as it moves, not 15 minutes late.Instant alertsEnable alerts on any scan — built-in or custom — and Zen pops a desktop and in-app alert the moment a new ticker appears. Price Pop alerts catch sudden moves on larger names and low-float runners as they happen. 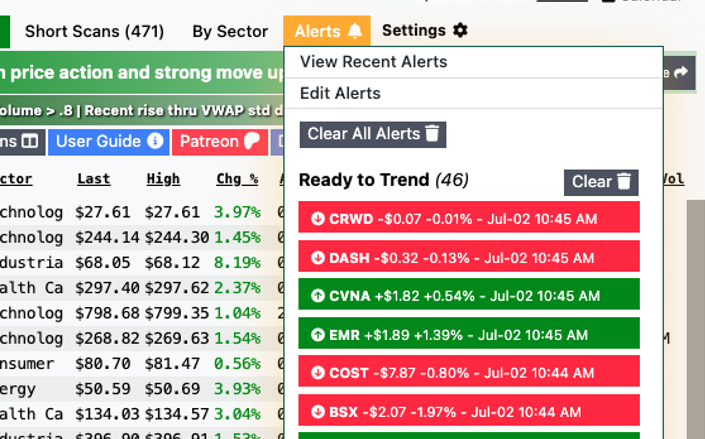
⚡
ZenBot Turbo · $25/mo
Get real-time scans, charts & alerts — every minute, live.
Standard runs on a 15-minute offset. Turbo unlocks live data and instant alerts.
Start 14-day free trial →
◐ Extended hours
Pre-market & after-hours scanningZenBot doesn't go dark at 4pm. Scans, alerts, and charts run through pre-market and after-hours sessions — so you catch gappers before the open and follow earnings movers into the night. Filter on pre-market high/low breaks and yesterday's range, live.
Pre-market scans
Momentum scans
After-hours alerts
Gap up / gap down
Above pre-market high
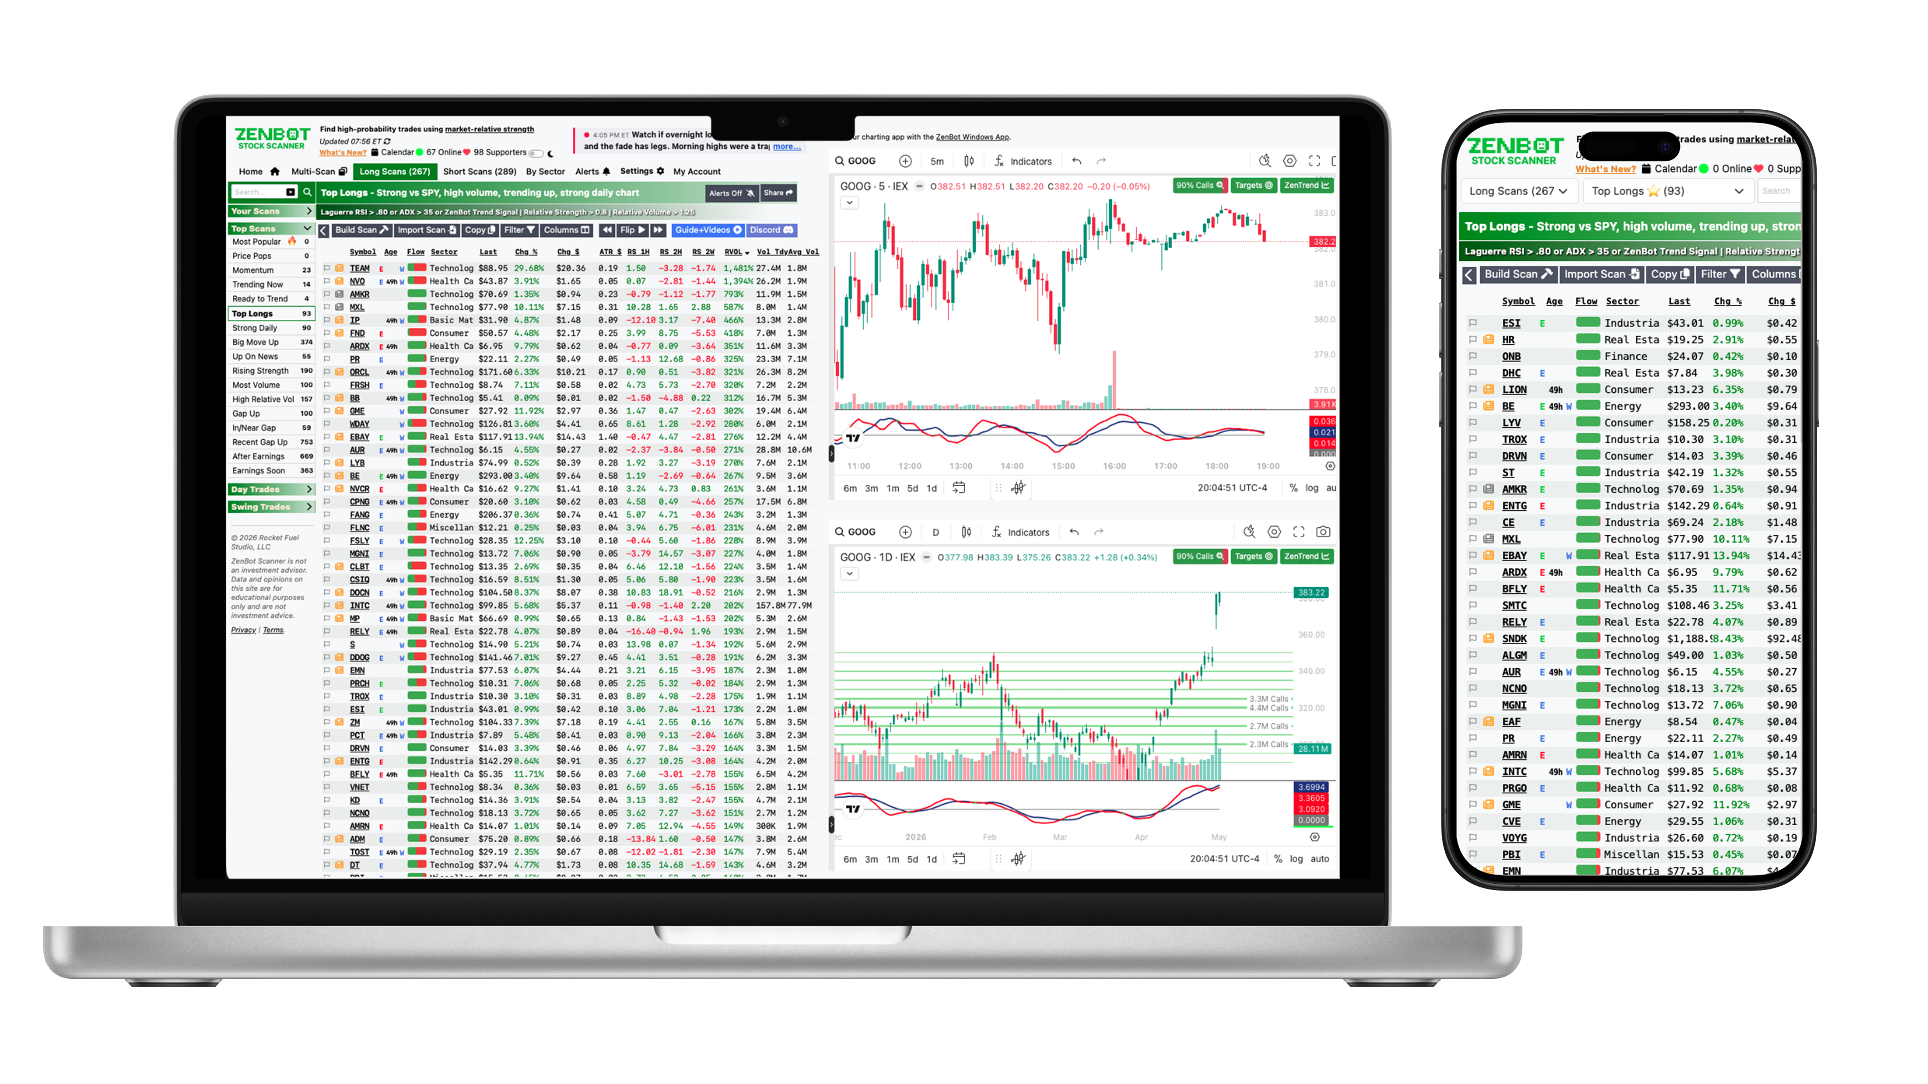
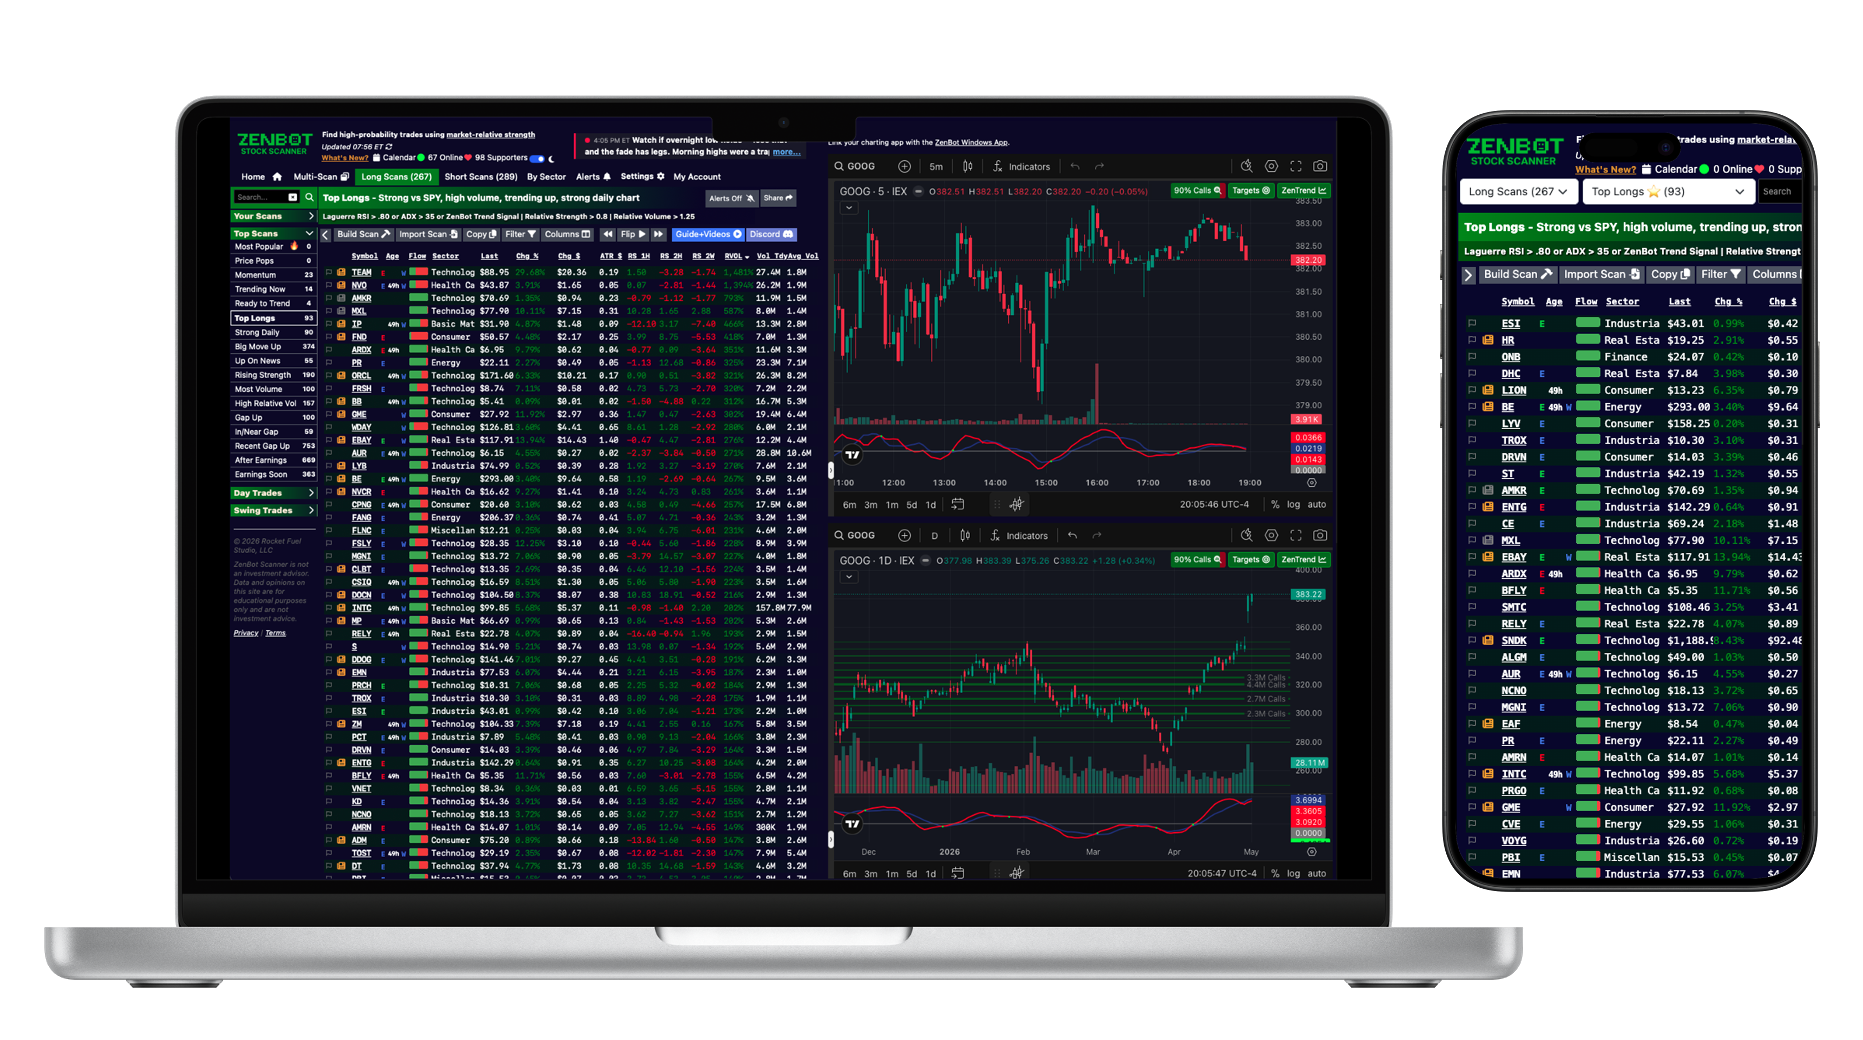
Cloud sync across web, desktop & mobileYour favorites, custom scans, multi-scan layouts, and chart settings sync automatically — open ZenBot on the web, on the Windows app, or on your phone, and everything's where you left it. Star a ticker on your laptop, see it flagged on your phone, alert fires on whichever device is in front of you.
Favorites & flags
Custom scans
Multi-scan layouts
Chart settings
Trade-ready on your phoneThe web app is built mobile-first — full scans, alerts, charts, and the Flow column all work on a phone screen. Step away from your desk without losing the day. No app store, no install, no second account — same login, same data.
Built mobile-first
No app install
Full scans + alerts
03 / Decide & execute
From signal to setup to chart, in one motion.◉ Unique to ZenBot
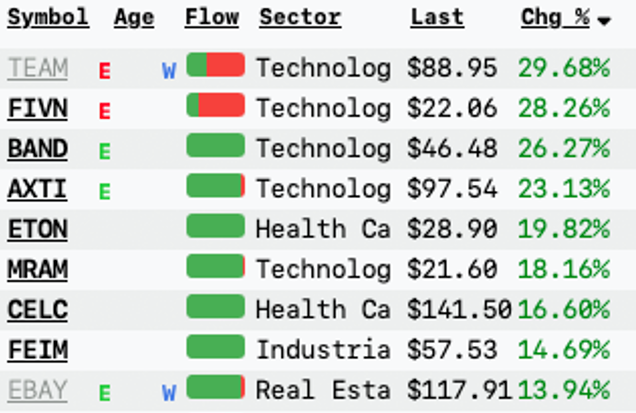
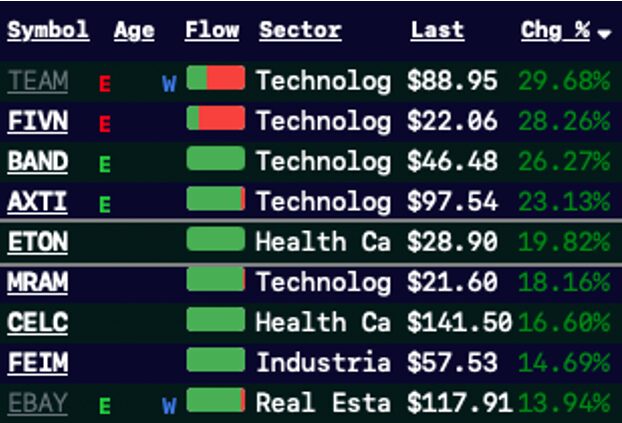
Options flow, baked into every scanThe Flow column shows you call vs. put pressure on every ticker at a glance — green for bullish, red for bearish. Click any ticker to see its full Delta Exposure (DEX) and Gamma Exposure (GEX) by strike — where the smart money is positioned, and which strikes will magnetize price. Filter scans by call/put DEX ratio so you only see names with real institutional interest.
Bullish/Bearish DEX %
Net Call DEX
Net Put DEX
GEX by strike
90-day expiry coverage
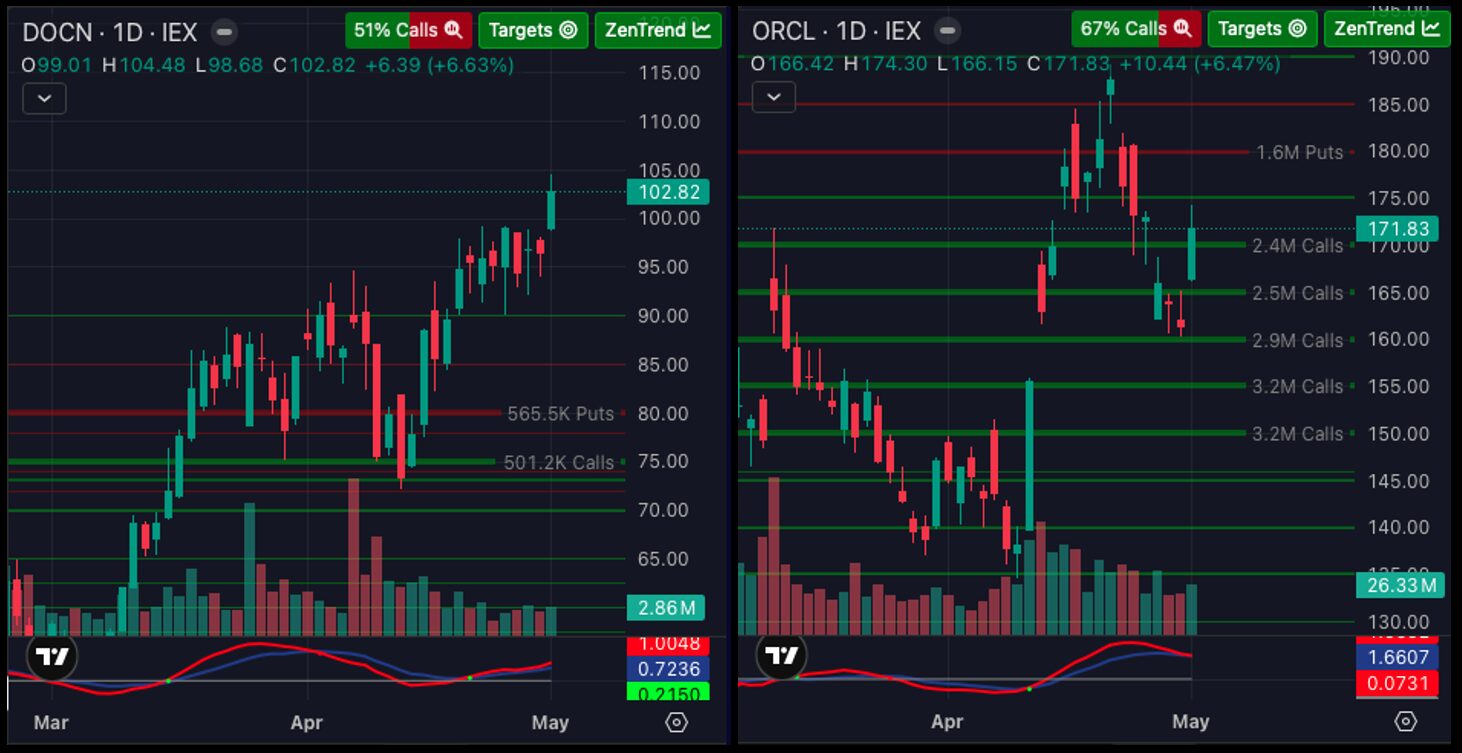
Options levels, drawn on every chartGreen lines show "call walls" — large open interest levels that act as targets and support. Red lines show "put walls" — resistance, or targets when shorting. The volume at each strike is labeled directly on the chart so you know which level matters. Same data that powers the Flow column, plotted where you trade. 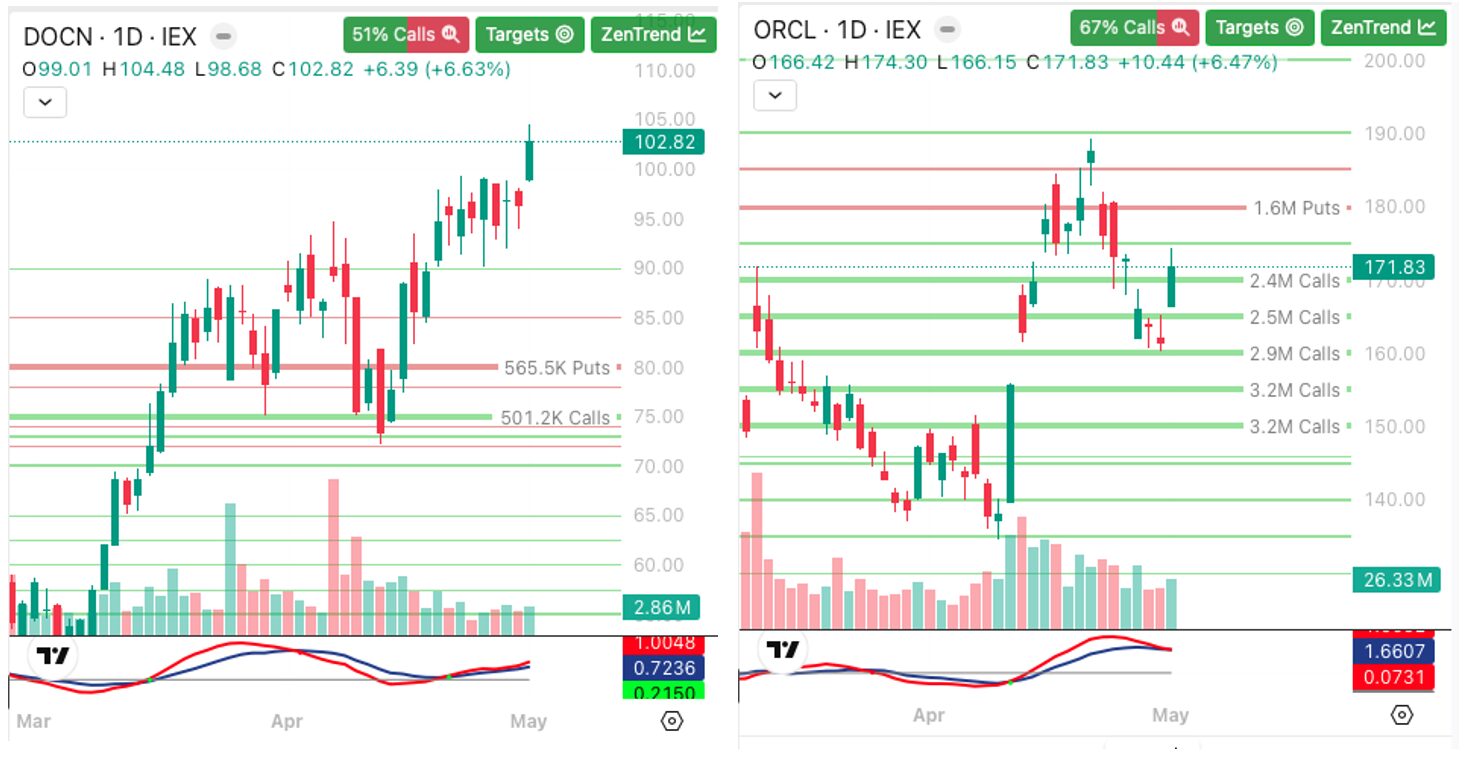
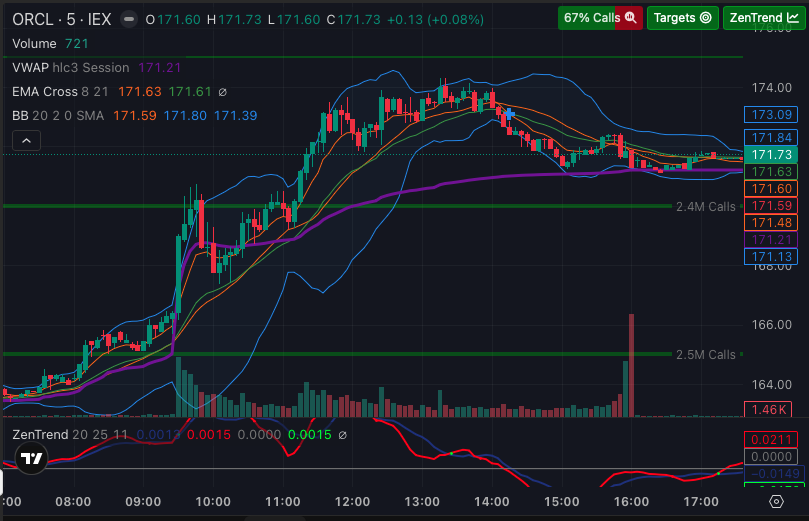
Built-in TradingView chartsFull-featured TradingView Advanced Charts embedded inside ZenBot — every indicator, drawing tool, and saved layout you'd expect. Add your favorites, customize them, and ZenBot remembers them across sessions. 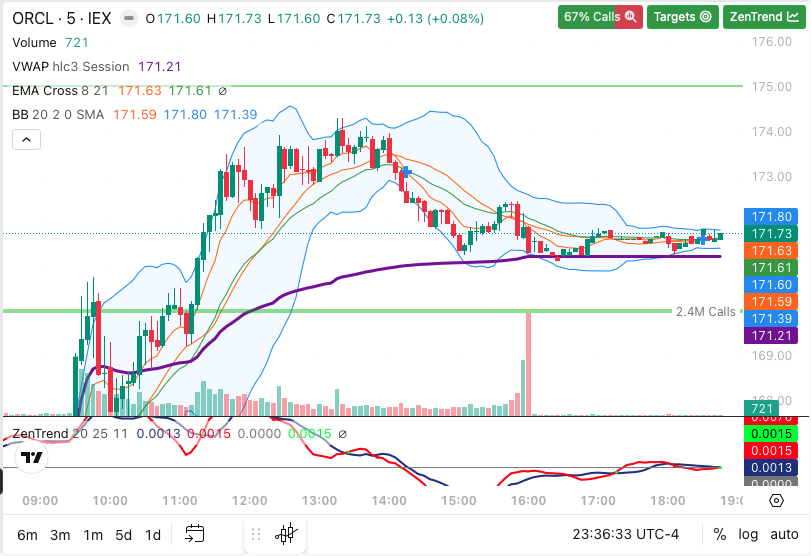
Multi-scan dashboardBuild a custom layout with all your favorite scans visible at once. Drag and drop scans between grid blocks, resize each pane, and pick any built-in or custom scan for any tile — your whole game plan on one screen. 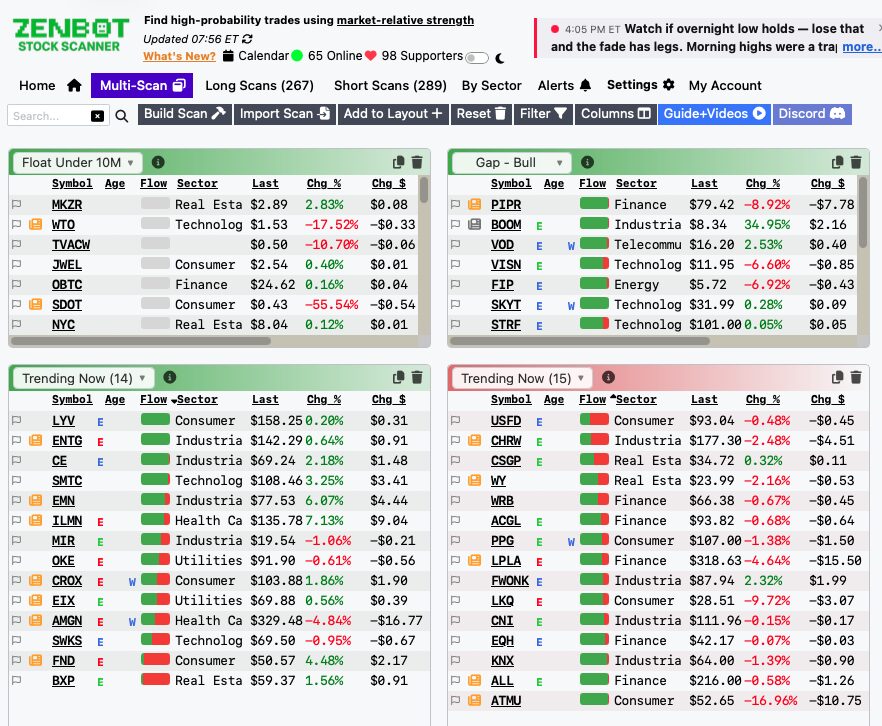
Windows app + chart integrationThe ZenBot Scanner Windows app auto-launches selected tickers into TradingView, ThinkorSwim, TC2000, IBKR, and more. Now with embedded charts, scan alerts, options levels, and account sync — everything from the web app, on your desktop. 
Everything in one place. Every minute of the session.ZenBot pairs the scans, alerts, charts, and commentary you need into a single workflow — built by traders, for traders.
×
❮
❯
|